


Written by: Bryan Grobstein, Vice President, Global Revenue, AnyRoad | Last updated: November 16, 2026
Key Takeaways
- Engagement quality measures durable value like repeat visits, advocacy, and purchases instead of simple attendance counts.
- Basic metrics such as daily active users and raw attendance fail to show whether an experience produced meaningful outcomes.
- A lifecycle framework captures signals before, during, and after every experience to track true engagement quality.
- Advanced metrics like repeat-visit rate, NPS movement, opt-in rate, and club enrollment conversion connect visits to revenue results.
- AnyRoad captures first-party data at every touchpoint, turns feedback into AI-analyzed themes with PinPoint, and links engagement signals to revenue outcomes.
See Engagement Quality In Your Own Data
Why Basic Metrics Fail And How To Define Engagement Quality
Daily active users, page views, and stickiness ratios were designed for software products. Applied to a distillery tour or brand home, they produce numbers that look like progress while explaining nothing. The Google HEART framework, introduced by Rodden, Hutchinson, and Fu at CHI 2010, identified this problem precisely. Rising page views can mean a feature is popular or that confused users are clicking around looking for an exit. A seven-day active count can rise even if the entire user base turns over completely each week. Their solution used ratios, percentages, and averages per user, each tied to a stated goal. This article applies that principle to physical experiences.
For a tasting room or brand home, the equivalent vanity metrics are raw attendance and ticket revenue. These metrics say nothing about whether a guest left as a promoter, enrolled in a club, or bought a second bottle. Pendo, Mixpanel, Amplitude, and Hotjar are strong tools for measuring clicks inside a digital product, but they cannot see the visit itself. They have no mechanism to capture a guest's pre-visit brand affinity, measure NPS movement from arrival to departure, or connect a tasting to a receipt-verified retail purchase. Engagement quality measurement starts by filling that gap.
How To Measure Engagement With A Visit Lifecycle Framework
A lifecycle approach to experience measurement tracks results before, during, and after the event, and each stage produces distinct signals. The discipline, borrowed from HEART's Goals-Signals-Metrics logic, starts with the goal, then identifies the signal, then converts it into a ratio instead of a raw count.

- Before The Experience: Booking source and channel mix reveal which acquisition channels produce the highest-quality guests. Pre-visit brand-affinity baseline establishes the starting point against which post-visit movement is measured. Opt-in rate at registration and data-capture completeness determine whether the visit produces a usable first-party record at all. AnyRoad's FullView feature captures data from every attendee in a group, not only the person who made the booking. Proximo Spirits found they were missing contact information for over 66% of their guests before implementing FullView, then immediately collected 69% more guest data and 34% more NPS responses.
- During The Experience: Check-in rate versus bookings surfaces no-show patterns. Dwell time and queue abandonment distinguish genuine engagement from pass-through traffic. Short dwell times often reflect congestion rather than genuine brand connection. Average time in the experience becomes a quality signal instead of a throughput metric. Offering and tier adoption, meaning which experience level guests choose, identifies the price points and formats that attract higher-value guests. On-site enrollment attempts and real-time feedback complete the during-visit picture.
- After The Experience: Post-visit NPS and NPS movement versus the pre-visit baseline measure perception change. Feedback sentiment and themes explain why the score moved. Repeat-visit rate, club enrollment conversion, receipt-verified purchase, and marketing opt-in rate are the downstream signals that connect the visit to revenue.
The Advanced Engagement Metrics That Matter For Experience Brands
A KPI for engagement is a metric tied to a stated goal that moves only when the experience improves, even if attendance stays flat. The six ratios below meet that standard. Each is written as a formula you can compute from data you already collect, and together they form the scorecard the rest of this article builds on.
- Repeat-Visit Rate = returning visitors ÷ total visitors in period
- NPS = % promoters (scores 9–10) − % detractors (scores 0–6)
- Opt-In Rate = marketing opt-ins ÷ total attendees
- Data-Capture Completeness = attendees with contact data ÷ total attendees
- Offering/Tier Adoption = attendees choosing a premium tier ÷ total attendees
- Club Enrollment Conversion = on-site enrollments ÷ eligible attendees pitched
These metrics have documented outcomes at brands using AnyRoad. Using AnyRoad analytics, Diageo measured a 16-point NPS increase from pre-visit to post-visit at Johnnie Walker Princes Street. A movement figure like that would never appear in a raw attendance count. Absolut Home achieved a visitor NPS of 75 and an 85% post-event brand conversion score. Those metrics justified a budget increase for premium experiences priced at over ten times the standard offerings. Average guest revenue has risen 36% since 2018.
Campari Group's partnership with AnyRoad produced a 3X increase in marketing opt-in registrations from brand home registrations, with one secondary source describing this as a 3X increase in marketing opt-in rates over six months. The partnership also identified 4,500 repeat visitors as brand champions, and average spend per customer has increased 25% since 2020. According to the AnyRoad case study, 48% of Campari Group visitors became brand promoters after their experiences, though some AnyRoad promotional materials cite 49% conversion to promoter.
Qualitative Signals As Operational Data
Open-text feedback becomes real data once it is grouped into themes and weighted by influence on NPS. It is the only signal that explains why a score moved. Aspect-based sentiment analysis scores each topic mentioned in a comment separately, such as staff, atmosphere, wait time, or offering. This approach ties guest sentiment to the specific part of the operation responsible, which makes it the most operationally useful form of feedback analysis for multi-location experience brands.
AnyRoad's PinPoint applies this approach at scale. It automatically analyzes thousands of open-text survey responses to identify key themes, sentiment drivers, and actionable suggestions in real time. The result explains the why behind the NPS number instead of only reporting it. Competitors in the product-analytics category give customer effort score a single bullet in a metric glossary. PinPoint turns the same raw material into a prioritized action list.
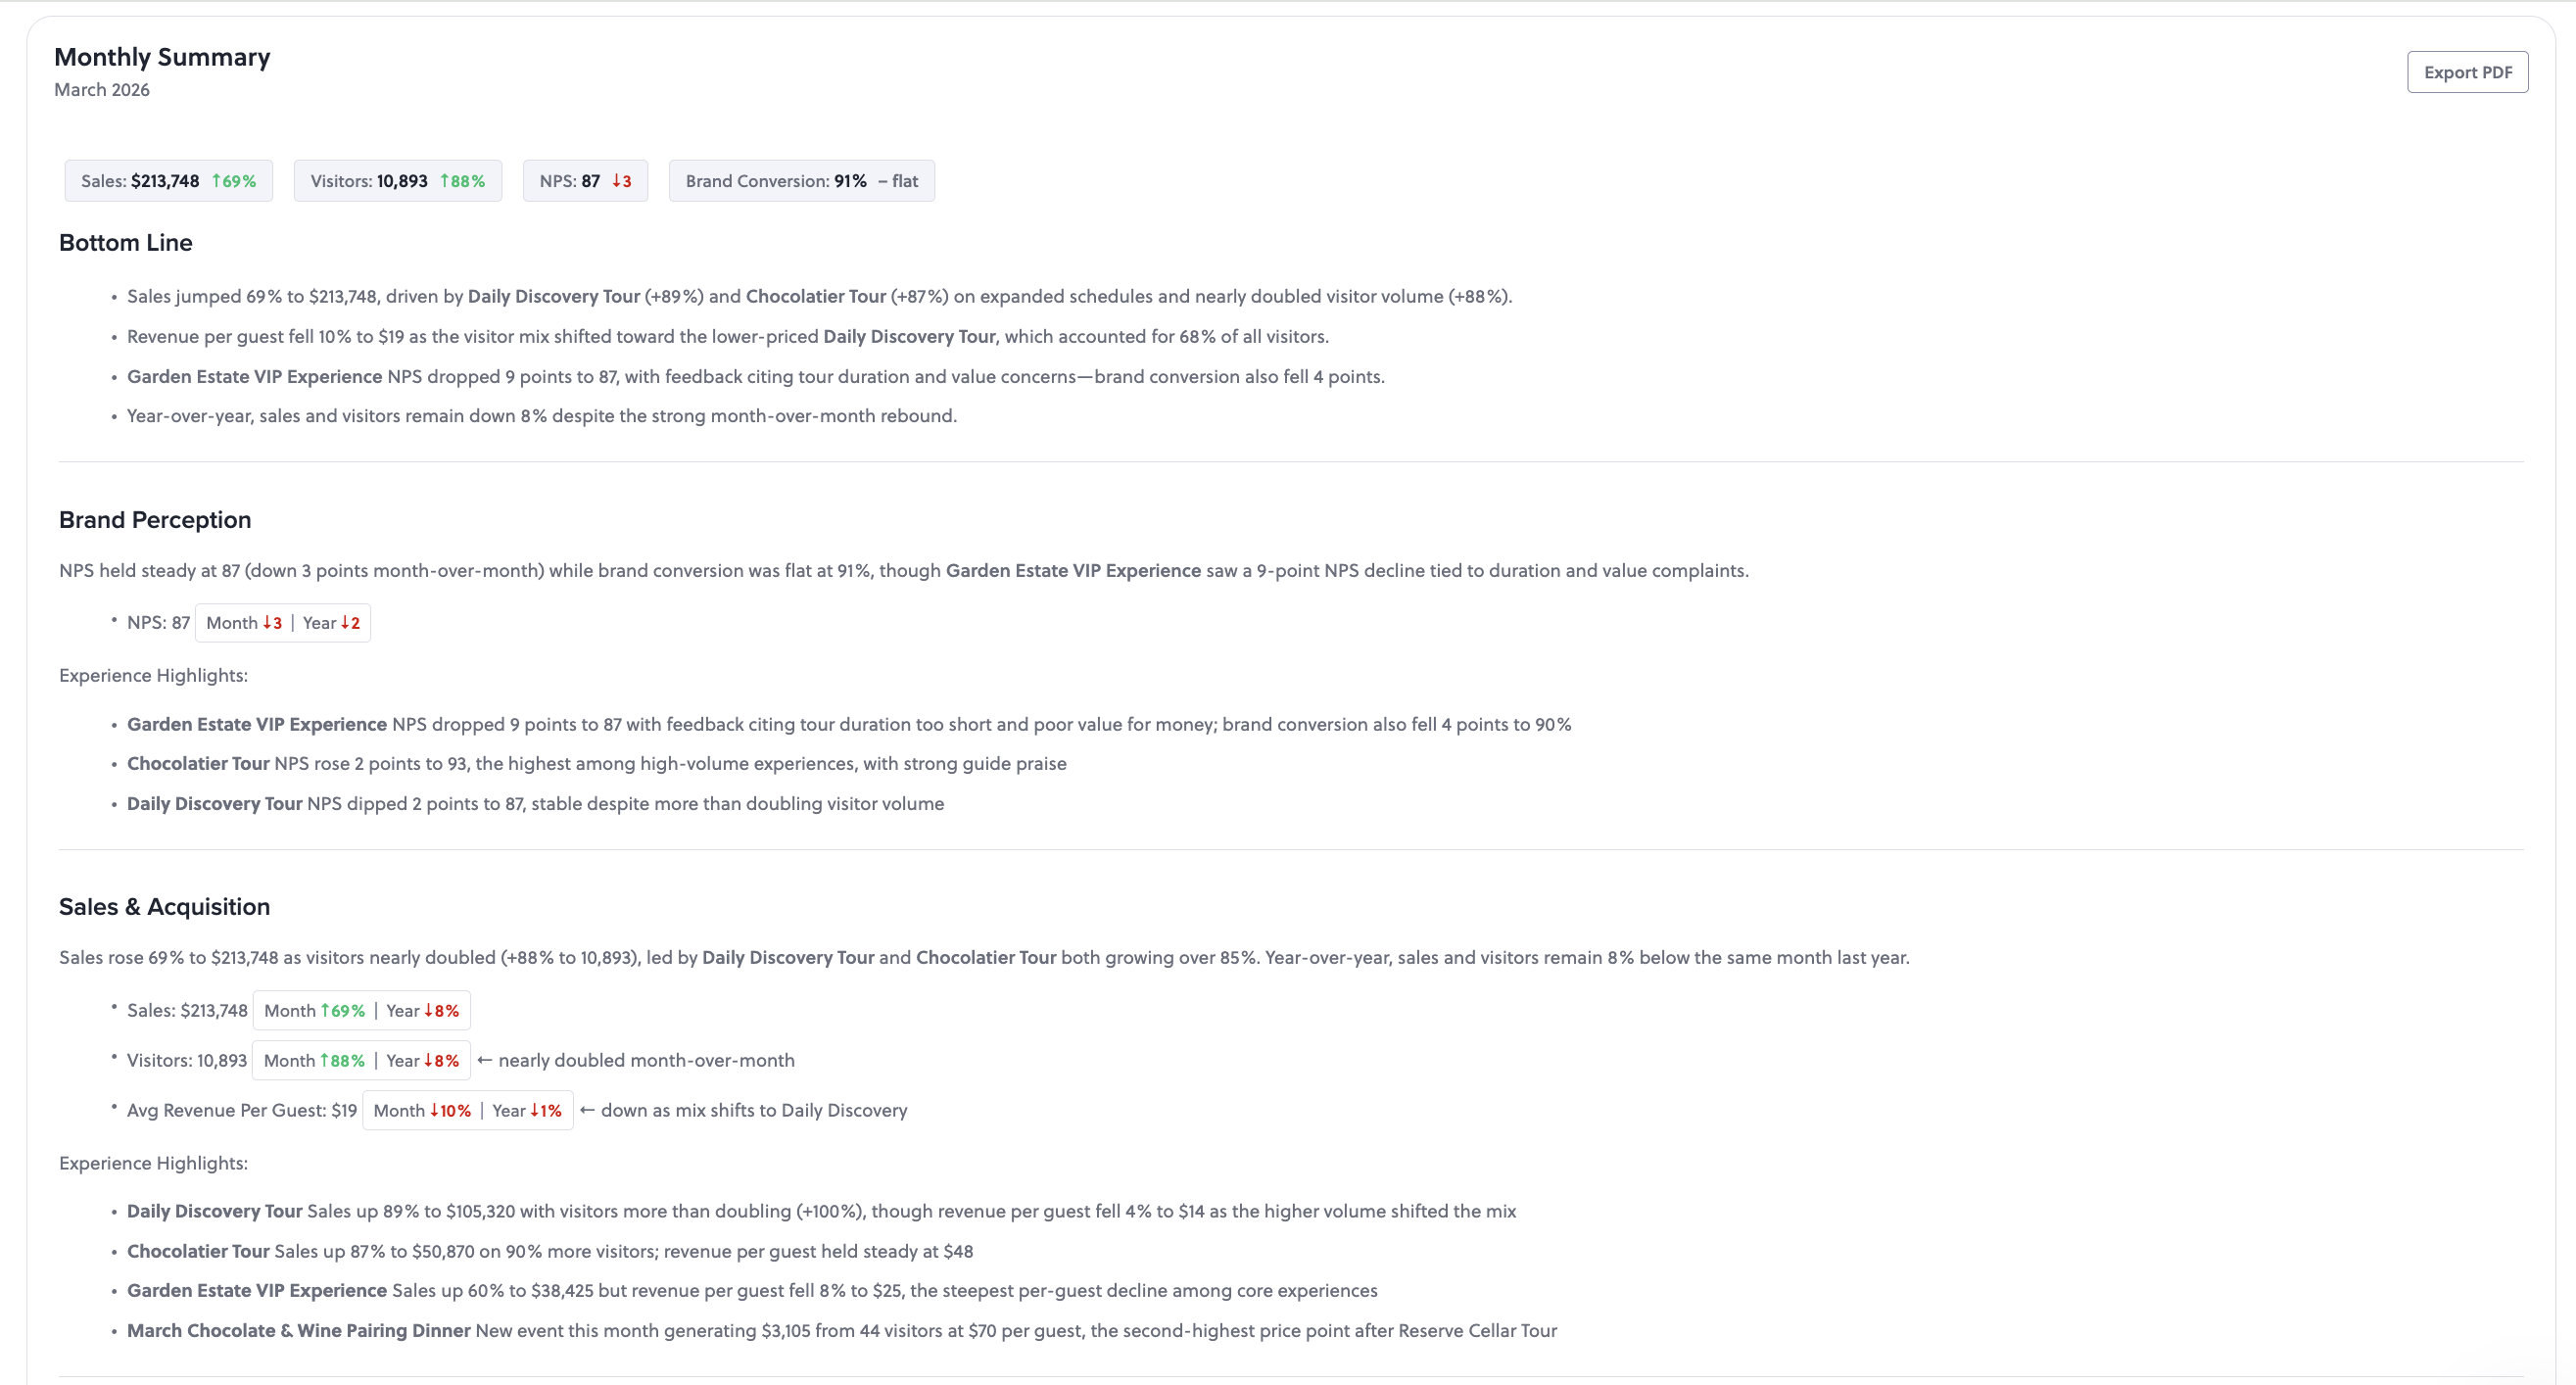
The commercial impact is documented. Leiper's Fork Distillery used post-event feedback to refine experiences, retail, and messaging, reaching a 97 post-event NPS and raising tour prices 33% from $18 to $24. That change produced their third-highest grossing month ever despite running fewer tours. St. Augustine Distillery analyzed feedback, found guests wanted a takeaway like glassware, and saw a double-digit increase in bookings for what became a premium experience. In both cases, the qualitative signal produced a quantitative revenue outcome.
Advanced experiential marketing analytics go well beyond what surface-level metrics can reveal. Qualitative feedback, analyzed at scale, often contains the most actionable insights.
Connecting Engagement To Revenue With The Visit-To-Membership Bridge
Experience brands grow fastest when they treat the path from visit to membership as a measurable bridge. No competing analytics platform covers this bridge. A consumer who visits a distillery twice is 512% more likely to convert into a paid loyalty enrollment, and that enrollment is where the money sits. A single retail bottle purchase is worth roughly $100 to a brand. A club member who stays through six releases is worth roughly $600. AnyRoad's reporting shows that experience-driven opt-ins convert to paid loyalty at four times the rate of traditional channels, and member spending increases 150% within the first year.
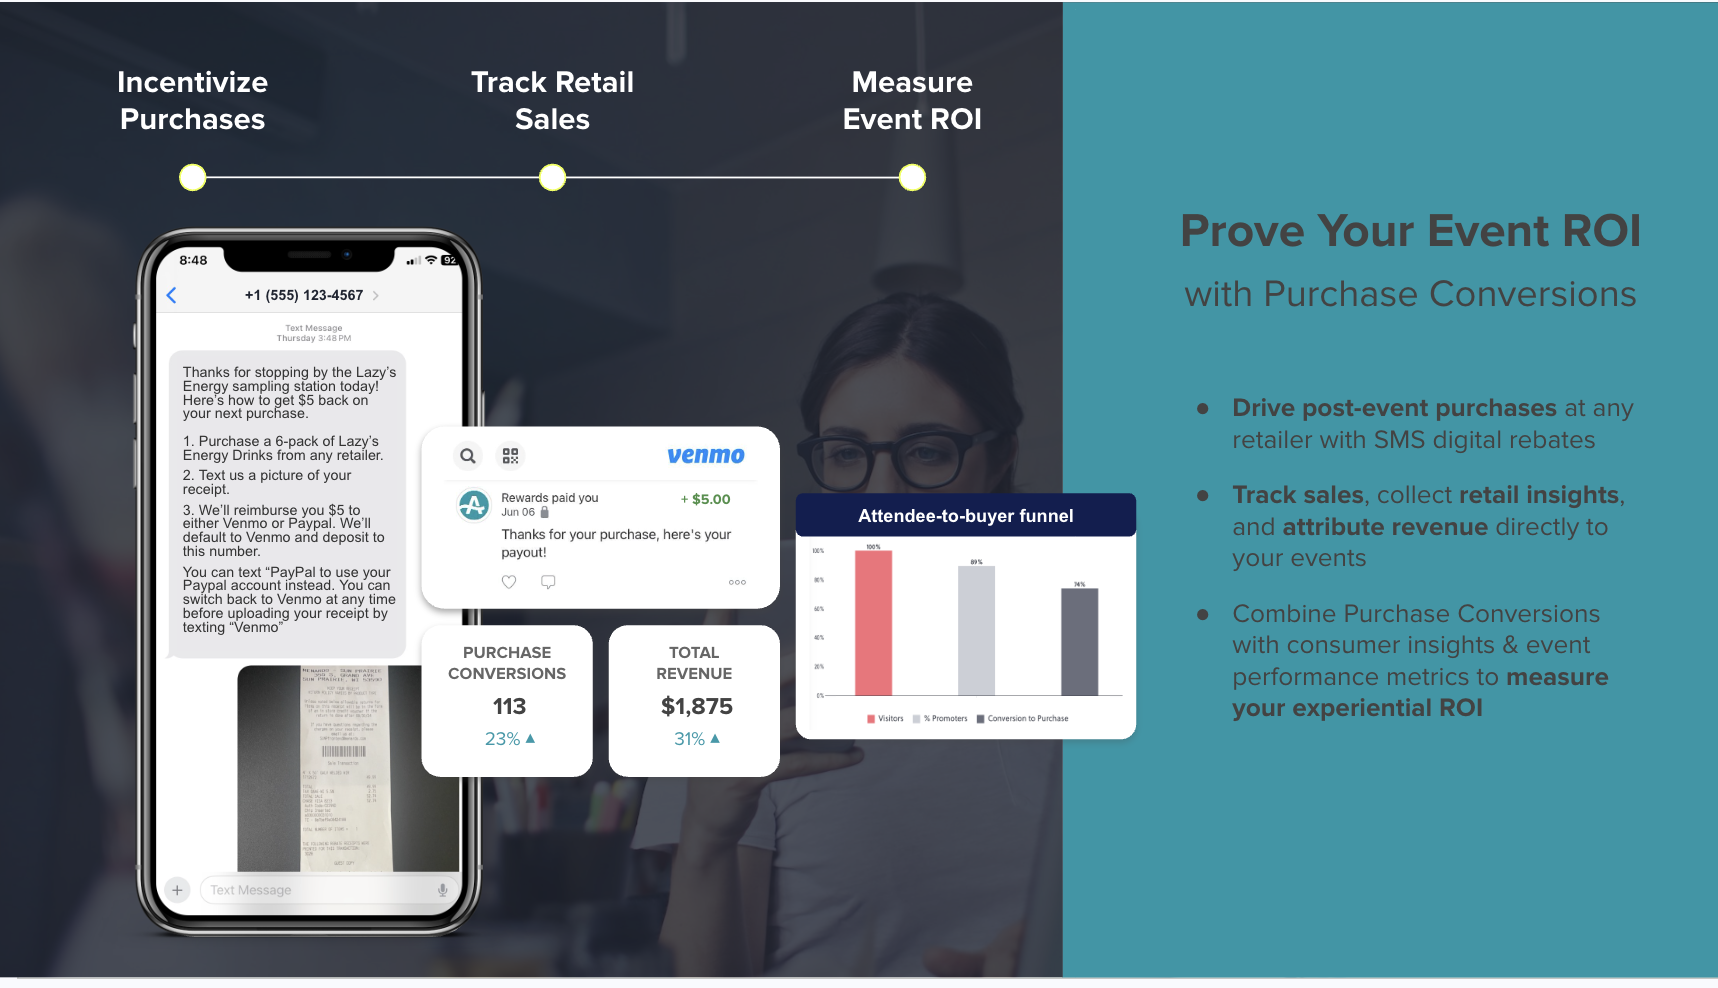
This math reframes repeat-visit rate from a satisfaction metric into a leading revenue indicator. The second visit signals that a guest is ready to be asked. Without a system that tracks visit frequency at the individual level and connects it to enrollment and purchase, that signal goes unread. A 2026 Brewers Association and Harris Poll Consumer Survey found that 58% of craft consumers say they purchase more of a brewery's product after visiting its physical taproom. That directional finding becomes actionable only when individual visit history is captured and linked to purchase behavior.
Behavioral analytics built for physical experiences make this connection systematic, replacing the assumption that a good visit produces revenue with evidence that a specific guest, on a specific visit, converted. The unit of that evidence is the cohort, not the crowd.
Connect Visits To Membership Revenue
Behavioral Cohorts For High-Value Experience Guests
Demographic segmentation, such as age, gender, and geography, describes who attended. Behavioral cohort analysis describes who is worth investing in. Segmenting by visit frequency, spend, NPS, and club status surfaces the guests most likely to enroll and repeat purchase. Staff can then pitch the club to the right people instead of everyone who walks through the door.
Absolut Home data showed that smaller guest groups generate higher revenue per guest and higher satisfaction. That cohort insight changed how they structured experiences. Aggregate attendance data hides that pattern. Behavioral segmentation at the individual-visit level brought it into view.
Two additional cohort metrics matter for experience brands. Time to value, meaning how quickly a first-time guest becomes a repeat visitor, identifies which experience formats accelerate the relationship. Engagement decay, meaning the drop-off in response and revisit behavior between experiences, identifies when a guest is drifting and when a re-engagement communication is warranted. AnyRoad's customer view lets brands stratify their audience at a micro level across all of these dimensions. The platform connects the visit record to NPS, spend, and club status in a single profile.
Real-time experiential marketing analytics make cohort-level insights available during and immediately after an experience, while the moment to act still exists.
Putting Engagement Data To Work With Dashboards And Tooling
AnyRoad is the system of record for experience engagement data. Three features do the capturing. Atlas Insights reports brand affinity, NPS, and purchase intent by experience, location, and demographics. PinPoint converts open-text feedback into prioritized themes. FullView captures whole-party data so every attendee, including the booker and their guests, produces a usable record.
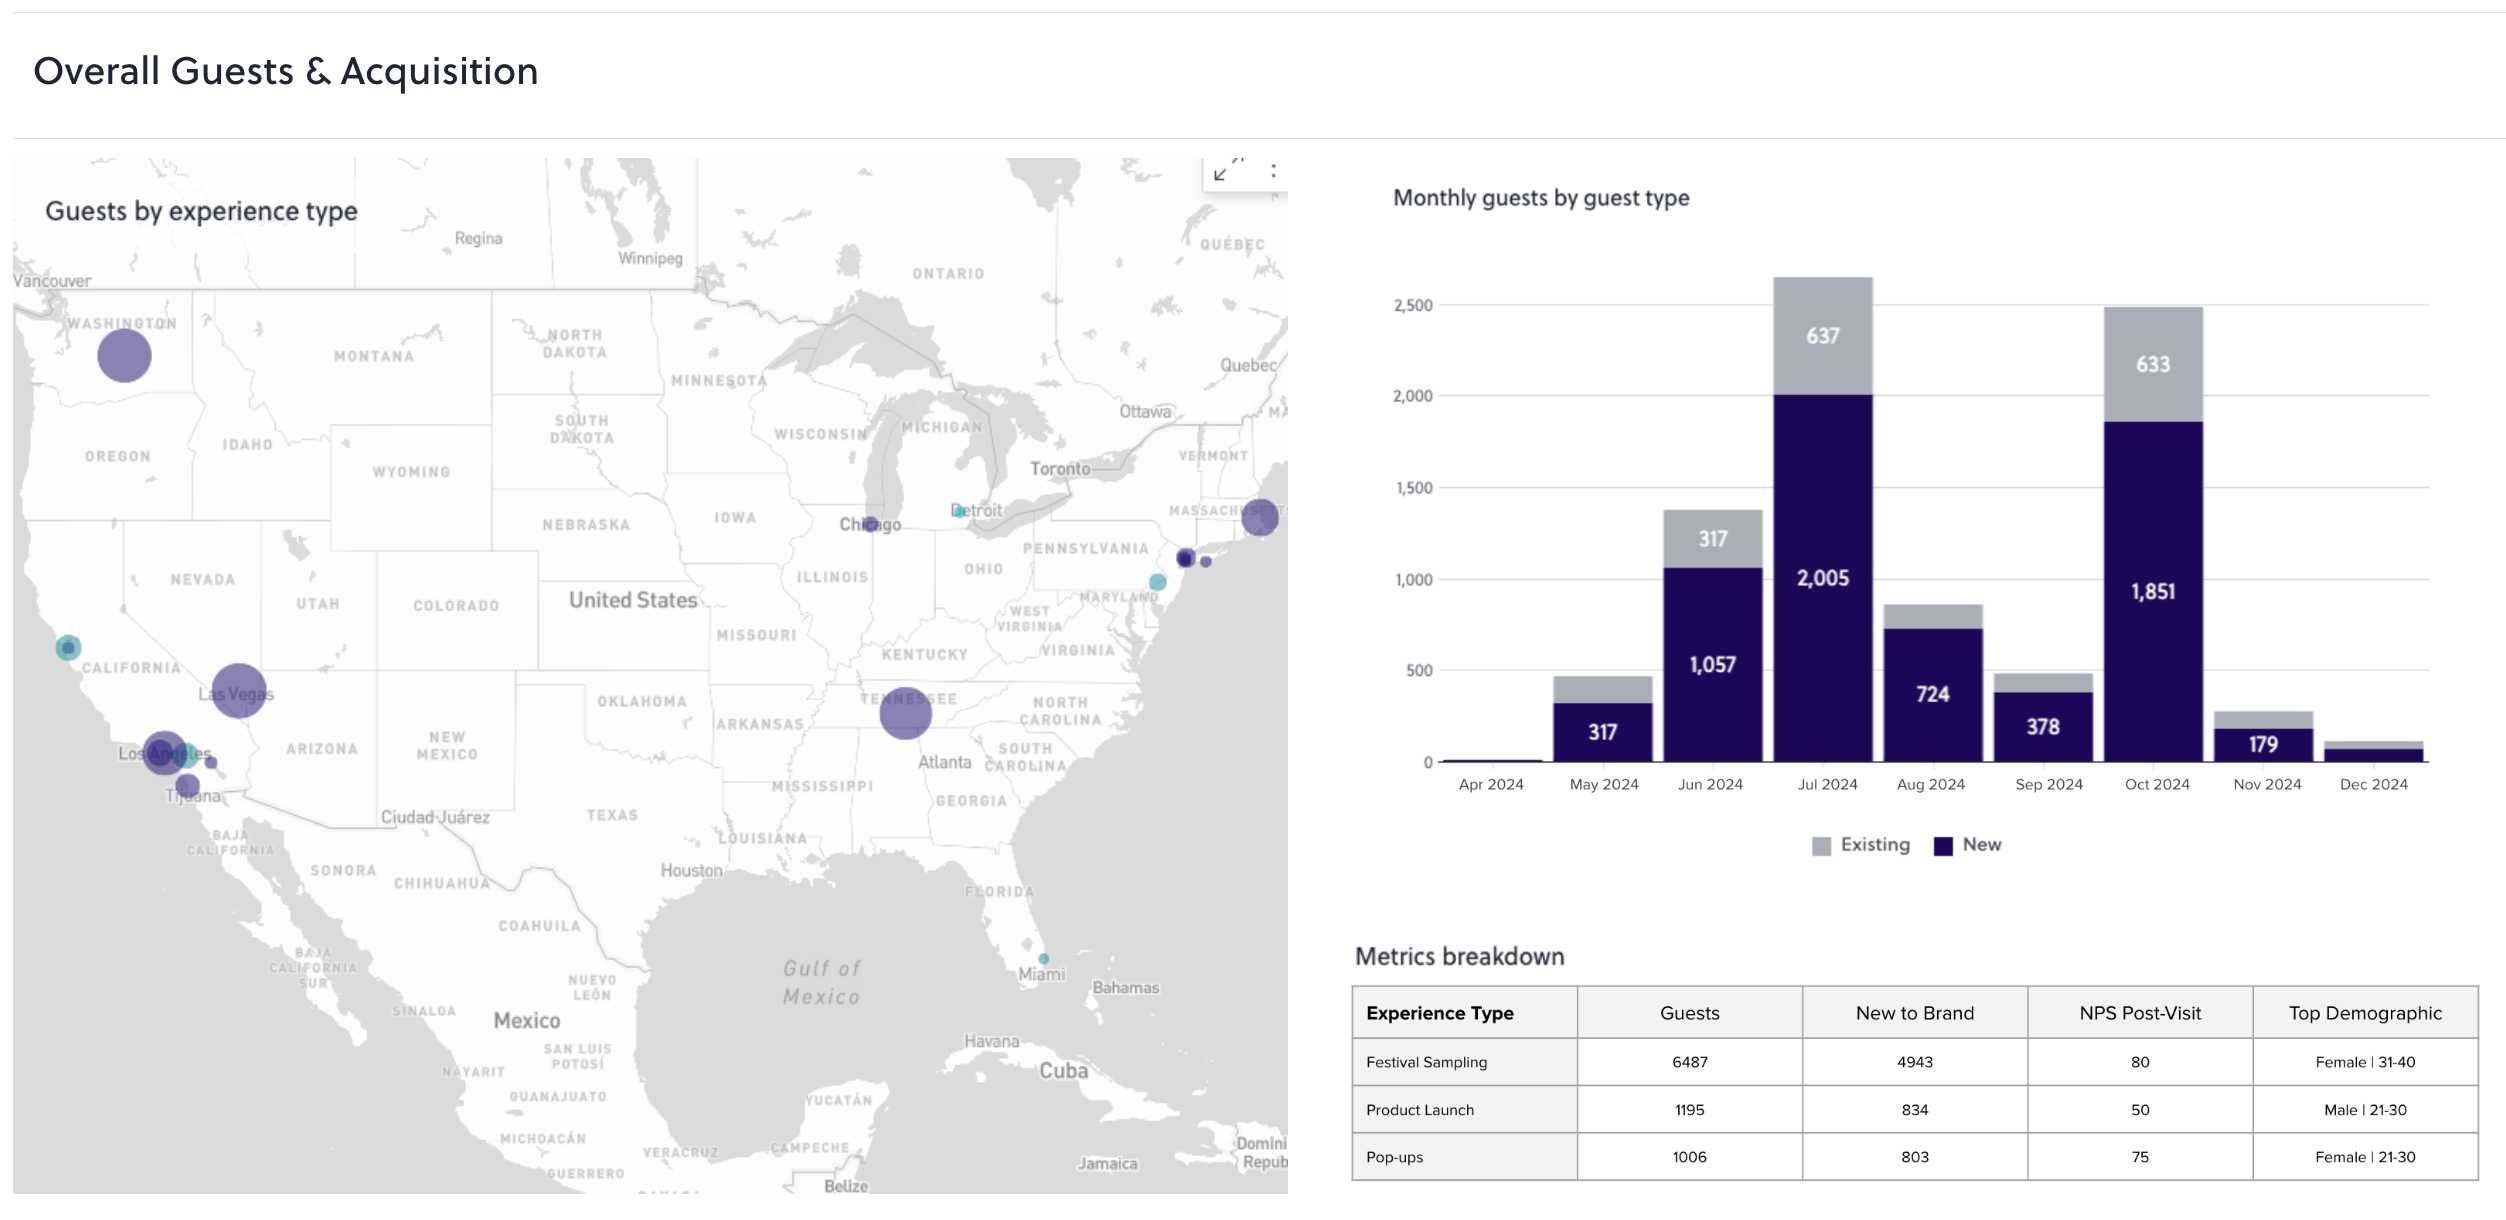
From there, native integrations push those signals into the tools you already run. AnyRoad connects to CRM and CDP platforms, email and marketing automation tools including HubSpot and Klaviyo, POS systems, ERP platforms including SAP and NetSuite, BI tools, and webhooks and API connections. Experience signals land in existing dashboards instead of a separate silo.
For the digital layer, Mixpanel and Amplitude are strong for product event tracking, Hotjar for on-site web behavior, and Pendo for in-product adoption. These tools measure what happens inside a software interface. They do not measure a tasting room visit, capture a guest's NPS movement from arrival to departure, or connect a check-in to a club enrollment. AnyRoad covers the physical experience layer they cannot reach and feeds the resulting data into the same stack.
Conclusion: Measure The Visit To Understand Engagement
The lifecycle framework gives a practical answer to how engagement quality gets measured. Define the goal, capture signals before, during, and after the experience, and report ratios instead of raw counts. Read the qualitative why behind every score movement. Bridge the visit to enrollment and purchase. Each stage produces signals the next stage depends on. Without before-visit baseline data, post-visit NPS movement has no context. Without individual visit history, repeat-visit rate becomes a population average instead of a lead indicator for a specific guest.
AnyRoad is the best platform for measuring user engagement beyond basic metrics because it captures first-party data at every touchpoint of an experience, turns open-text feedback into AI-analyzed themes with PinPoint, and connects engagement signals to downstream revenue like club enrollment and retail purchase. Pendo, Mixpanel, Amplitude, and Hotjar measure what happens inside a digital product and focus on retention and churn. They cannot see the visit. AnyRoad can, and it connects what it sees to the revenue outcomes that justify the experience budget.
Frequently Asked Questions
How Do You Measure Engagement?
Start by defining the goal, then identify the user behaviors that signal progress toward it, then convert those signals into ratios instead of raw counts. For physical brand experiences, that means tracking repeat-visit rate, NPS movement from pre-visit to post-visit baseline, club enrollment conversion, and marketing opt-in rate, instead of attendance volume alone. Raw attendance tells you how many people showed up. The metrics above show whether the visit produced durable value. Capture data at every stage of the lifecycle, before, during, and after, so each metric has the context it needs to be interpretable.
What Is A KPI For Engagement?
A KPI for engagement is a metric tied to a stated goal that moves only when the experience improves, even if attendance grows for unrelated reasons. For experience brands, strong engagement KPIs include repeat-visit rate, post-visit NPS, opt-in rate, and data-capture completeness. Each of these moves when the experience produces genuine value. A guest who returns, recommends, or opts in is a guest the experience converted.
What Are Examples Of Engagement Metrics?
For brand-owned physical experiences, the most predictive engagement metrics are repeat-visit rate, NPS and NPS movement versus a pre-visit baseline, feedback sentiment and themes by topic, offering and experience-tier adoption, opt-in rate, data-capture completeness, club enrollment conversion, and receipt-verified purchase rate. Each metric answers a different question about the visit's quality. NPS movement shows whether perception improved. Repeat-visit rate shows whether the guest valued the experience enough to return. Club enrollment conversion shows whether the visit produced recurring revenue. Together they form a complete picture of engagement quality.
What Are Two Metrics A Media Website Might Use To Measure Engagement?
A media website typically tracks scroll depth, meaning how far down a page a visitor reads, and return-visitor rate, meaning the share of visitors who come back within a defined period. The experiential equivalents are dwell time, meaning how long a guest actively engages with the experience, and repeat-visit rate. Both pairs measure depth of engagement instead of surface-level exposure, which is why they are more predictive of downstream behavior than page views or raw attendance.
Who Should Own Engagement Measurement?
Marketing owns the framework and the revenue bridge. That team defines the goals, sets the KPIs, and connects engagement signals to enrollment and purchase outcomes. Operations owns during-visit capture, including check-in rate, dwell time, offering adoption, and real-time feedback. Both functions share one dashboard. When measurement is split across separate tools with no shared data layer, the signals that matter most, such as the ones that connect a specific guest's visit history to their enrollment status and purchase behavior, never get produced. A single platform that captures the full lifecycle eliminates that gap.
How Soon After An Experience Should You Measure?
Capture feedback in the moment and follow up within 24 to 48 hours, before recall fades. A survey triggered immediately after check-out measures the experience itself. A batch email sent a week later measures a memory that has already been filtered and compressed. NPS should always be reported as movement against a pre-visit baseline instead of as a standalone post-visit score, because the change proves the experience produced value. Operational metrics such as check-in rate, dwell time, and offering adoption are available in real time and should be reviewed before the next session, not at the end of the month.
Do We Need A New Tool To Do This?
You need a system that captures the visit itself. Digital analytics tools such as Pendo, Mixpanel, Amplitude, and Hotjar are built for software interfaces and cannot see a tasting room, a brand home, or a field activation. They have no mechanism to record a guest's pre-visit brand affinity, measure NPS movement across the experience, or connect a check-in to a club enrollment. AnyRoad sits at the center of the experience data layer and feeds the resulting signals into your existing CRM, marketing automation, POS, ERP, and BI tools through native integrations and API connections. The goal is to give your stack the experience data it currently cannot see.