


Written by: Bryan Grobstein, Vice President, Global Revenue, AnyRoad | Last updated: October 15, 2026
Key Takeaways From The Eight-Step Framework
- Activity metrics like attendance and samples distributed do not prove ROI. Only incremental sales lift measured against a credible control group answers finance’s question about incremental revenue.
- Build a matched-market or holdout control group before the activation begins. Then isolate incremental lift by subtracting the control group’s change from the exposed group’s change.
- Calculate true ROI using contribution margin, not revenue alone. Include every cost line item finance will scrutinize in the denominator.
- Use receipt-verified rebates or sweepstakes when no POS integration exists. This approach captures purchases at third-party retailers and on-premise accounts and ties them to first-party guest records.
- Standardize a 30/60/90-day scorecard, report uncertainty with confidence intervals, and document your control design so finance can review and approve the method.
- Operational consistency, including staffing, timing, and compliance, determines whether your lift numbers are clean enough to defend in a quarterly business review.
- AnyRoad’s Purchase Conversion Tools, Atlas Insights, and Lifetime Loyalty suite make this eight-step measurement procedure operational at scale.
- Closing the loop from activation to verified purchase and repeat behavior turns one-time events into measurable, recurring revenue.
See How AnyRoad Measures Sales Lift
Prerequisites For A Defensible Measurement Setup
Confirm a few foundations before running any step in this procedure.
- A defined activation with clear start and end dates
- A baseline period of at least 8–12 weeks of pre-activation sales or shipment data
- Access to sales, shipment, or verified-purchase data for the exposed market
- A control market or holdout group that did not receive the activation
- A complete cost ledger covering every line item finance will scrutinize
- Written agreement with finance on the contribution-margin definition used in the ROI formula
This procedure applies before, during, and after an activation. It supports measurement, reporting, and budget defense at quarterly business reviews.
This article covers sales-lift and incrementality measurement only. For other dimensions of brand activation ROI, see How To Measure Brand Activation ROI On Brand Awareness, How To Measure Customer Sentiment From Brand Activations, How To Measure Brand Activation ROI And Customer Engagement, How To Measure Event Activation ROI Beyond Attendance, and the How To Measure Brand Activation ROI: Complete 2026 Guide.
Step 1: Separate Activity From Outcome
Objective: Distinguish leading indicators from lagging indicators before any calculation begins.
Prepare: Compile every metric currently included in activation reports: dwell time, opt-in rate, cost per meaningful interaction, samples distributed, social impressions, and attendance.
Action: Classify each metric as either an activity metric or an outcome metric. Outcome metrics include incremental units sold, average order value among activation-exposed consumers, and repeat purchase rate at T+30 and T+90.
Checkpoint: Only outcome metrics feed the ROI calculation. Activity metrics belong in the operational section of a report; only outcome metrics belong in the financial return section.
Step 2: Build A Credible Counterfactual Without Randomizing Consumers
Objective: Create a control group for a live activation without randomizing individual consumers.
Prepare: Identify candidate control markets matched to the exposed market on geography, historical sales trend, seasonality index, and promotion calendar. Measured recommends aiming for at least 10–20 markets per group to detect a 10% lift with 80% statistical power, with outcomes normalized by population or historical volume before computing differences.
Action: Select a holdout market or matched-market pair. Define the baseline window as a minimum of 8–12 weeks pre-activation. The IAB and IAB Europe Guidelines for Incremental Measurement in Commerce Media rank experiment-based methods among the strongest causal methodologies. These methods include randomized controlled trials, holdouts, ghost ads, and matched markets. They rest on three principles: credible counterfactuals, control of bias, and separation of signal from noise. Nielsen’s 2019 incremental lift guidance states that the only true way to measure causality is to test channels or campaigns and compare sales metrics for two groups of buyers, those who saw the ads and those who did not. This procedure applies those standards to the brand activation context.
Checkpoint: Control and exposed markets are statistically similar on all matched variables before the activation begins. Document the match criteria so finance can review the design.
Step 3: Isolate Incremental Lift
Objective: Calculate the sales difference attributable to the activation.
Prepare: Collect exposed-market sales, control-market sales, and the pre-period baseline for both markets.
Action: Subtract the control group’s change from the exposed group’s change. The standard relative-lift formula is: ((test group conversion rate − control group conversion rate) / control group conversion rate) × 100. Incremental revenue is the treatment group’s observed revenue minus the revenue the control group would have generated, scaled for any differences in market size.
Checkpoint: The output is a single incremental sales lift number expressed in units or revenue, with the calculation method documented alongside it.
Step 4: Calculate Incremental ROAS And True ROI
Objective: Move from lift to financial return using contribution margin, not revenue alone.
Prepare: Assemble total activation investment (see Step 5) and the finance-approved contribution margin per unit. Contribution margin equals revenue minus variable costs including cost of goods, shipping, payment processing, and variable fulfillment.
Action: Compute incremental ROAS as incremental revenue divided by total activation cost. Compute true ROI as (incremental contribution margin minus total activation investment) divided by total activation investment. Contribution-margin ROI measures profit attributable to marketing rather than revenue, and omitting contribution margin can make a loss-making campaign appear to be a 4x winner.
Checkpoint: An activation with a 2.5x incremental ROAS can still post 0% true ROI when contribution margin is thin and costs are fully loaded. To see why, calculate break-even ROAS: it equals 1 divided by the contribution margin rate. At a 25% margin, break-even is 4x. At a 40% margin, it is 2.5x. Finance will perform this check, so run it first.
Step 5: Assemble The Total Cost Input Checklist
Objective: Capture every cost finance will ask about before the review meeting.
Prepare: Open a cost ledger with the following line items:
- Production (creative, fabrication, signage)
- Venue and permits
- Staffing and training
- Travel and accommodation
- Samples and product allocated to the activation
- Technology and platform fees
- Agency fees and third-party services
- Overhead allocation (a share of fixed costs attributable to the activation)
- Opportunity cost (revenue foregone by allocating staff or inventory to this activation)
Action: Total all line items into one activation investment figure. This figure is the denominator in both the incremental ROAS and true ROI formulas.
Checkpoint: Finance can review the checklist without asking for missing categories. If a line item is excluded, document the reason in writing.
Step 6: Measure Lift When You Do Not Control The Transaction
Objective: Connect an activation to a bottle sold at a third-party retailer or on-premise account without POS integration.
Prepare: Set up a QR registration flow, an SMS follow-up sequence, and a cashback rebate or sweepstakes offer. AnyRoad’s Purchase Conversion Tools support this mechanic at ambassador tastings inside third-party retailers such as Total Wine and at on-premise accounts. The AnyRoad Live mobile app is part of this toolkit.

Action: Capture guest data at the activation via QR code registration. Send a cashback rebate or sweepstakes entry via SMS. The consumer purchases the bottle at any participating retailer, photographs the receipt, and texts it back. AnyRoad’s AI reads the receipt, confirms the eligible SKU, and pays the rebate via Venmo or PayPal. This flow requires no POS integration at any point in the chain.
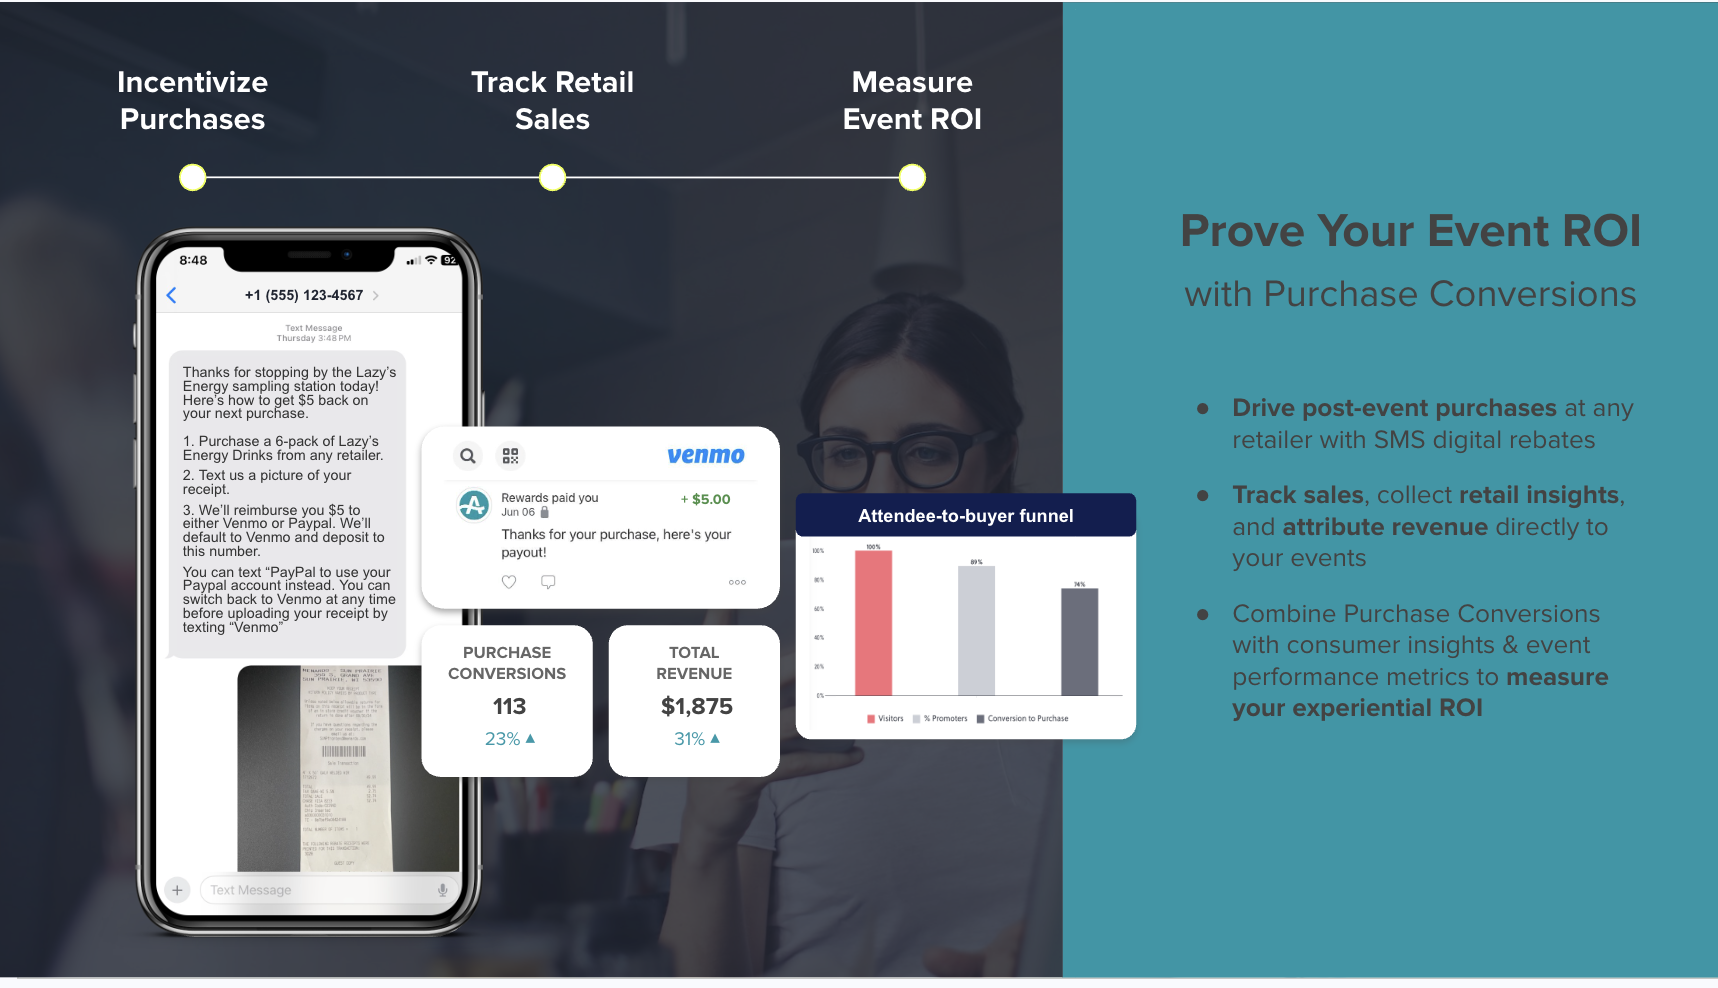
Checkpoint: Every redeemed rebate is a receipt-verified purchase tied to a first-party record. In a one-month ambassador tasting pilot with a single unnamed craft brand, 56% of records collected converted to a bottle purchase. This result is an early, small-sample pilot outcome, not a platform benchmark.
That pilot illustrates why this mechanic matters. It is what makes on-premise and third-party retail conversion tracking possible at all. Two customer examples show how it works in practice: In Conversate Collective’s field marketing events for a CPG beauty brand, over 50% of surveyed consumers bought the brand’s products from Walgreens and Target, demonstrating that purchase location data at third-party retailers can be captured and attributed without direct POS access. At POPLIFE’s festival activations for an artisanal mezcal brand, 85% of consumers reported post-event intent to purchase the product, outcome metrics that go well beyond attendance counts.
Step 7: Report Uncertainty Honestly
Objective: Give finance a confidence range, not a single heroic number.
Prepare: Collect sample sizes, control-group variance, and the lift estimate with its standard error.
Action: State whether the lift is statistically distinguishable from zero at the 95% confidence level and provide the full confidence interval. A credible activation-lift claim should report the estimated lift together with its confidence interval. If the interval includes zero, the data do not establish that sales lift is distinguishable from no effect. A well-run incrementality test will almost always produce a smaller number than reported ROAS. That smaller number is more accurate even when it is less flattering.
Checkpoint: The report includes a lift estimate, a 95% confidence interval, the sample size, and a plain-language statement of what the interval means for the budget decision.
Step 8: Deploy A 30/60/90-Day Measurement Scorecard
Objective: Standardize what to track before, during, and after every activation so results are comparable across markets and quarters.
Prepare: Build a scorecard with fields for pre-activation baseline (8–12 weeks), on-site data capture rate, T+30 repeat purchase rate, and T+90 brand-tracker survey timing.
Action: Assign an owner to each field and set a review cadence. Complete the scorecard the same way for every activation so lift figures can be compared quarter to quarter without methodological drift.

Checkpoint: The scorecard is repeatable across markets and activation types. Any deviation from the standard method is documented before the activation runs, not after results are reviewed.
Even a well-designed measurement procedure fails if the data collection itself is inconsistent. The next section covers the operational factors that determine whether the numbers you feed into the scorecard are clean enough to support a defensible lift claim.
Operational Considerations For Consistent Execution
Measurement quality depends on execution quality. Several operational factors determine whether the data collected is clean enough to support a defensible lift claim.
Staffing and training: On-site staff such as tour guides, retail managers, mixologists, and brand ambassadors must be coached to make the QR registration and rebate enrollment pitch consistently. AnyRoad’s white-glove service includes on-site staff coaching as part of its platform delivery, because software alone does not get a brand ambassador to confidently complete the data capture flow at a third-party retailer tasting.
Timing: Baseline windows must be set before the activation begins. SMS rebate offers should be sent within 24 hours of registration while purchase intent is highest. Rebate redemption windows should be long enough to capture the full purchase cycle for the category. Alcohol rebates, including spirits, typically require submission within 30–90 days of purchase to capture the full purchase cycle. T+30 and T+90 follow-up surveys should be scheduled at activation launch, not after the fact.
Compliance: For regulated categories including alcohol, age verification must be embedded in the registration flow. Sweepstakes require compliant terms and conditions, bonding where required by state law, and a GDPR- or CCPA-compliant privacy policy. AnyRoad handles regulatory compliance for its sweepstakes mechanic, including terms and conditions and privacy policies.
Consistency: The same registration flow, the same SMS sequence, and the same rebate structure must be used across locations and activation types. Inconsistent execution produces incomparable lift figures and undermines the matched-market design.
Get A Demo Of Receipt-Verified Conversion
Common Mistakes And Troubleshooting
Even with the right operational setup, certain errors appear repeatedly in activation measurement. Each has a documented fix.
Reporting attendance and samples as ROI. Attendance and samples are activity metrics, so they belong in the operational section of a report. The financial return section should contain only incremental lift and true ROI calculated against a counterfactual.
Using a control group that differs from the exposed market. A control market that differs on historical sales trend, seasonality, or promotion calendar will produce a spurious lift estimate. Match markets on all three variables before the activation begins and document the match criteria.
Ignoring carryover and spillover. Activation effects persist beyond the event window, and control markets can be contaminated by national media buys or out-of-home placements. Extend the measurement window to at least T+30 and check whether control markets were exposed to the same media during the test period.
Under-reporting costs. Finance will find the missing line items. Use the total cost input checklist from Step 5 and include overhead allocation and opportunity cost in the denominator before presenting results.
Claiming lift without statistical support. A lift estimate that falls within the noise floor is not reliable for decision-making. Report sample size, confidence intervals, and whether the result is statistically distinguishable from zero at the 95% level.
Assuming POS integration is required for third-party retail. The receipt-verified rebate and sweepstakes mechanic operates entirely on the receipt, requiring no retailer or bar to integrate any system. It works in any account at scale.
Measuring Success: Checkpoints That Finance Will Accept
This procedure aims to produce a defensible number that finance accepts as a credible basis for budget decisions. The following checkpoints define what a complete measurement looks like:
- Baseline similarity between control and exposed markets, documented before the activation
- Percentage of activation guests captured as first-party records
- Rebate redemption rate among registered guests
- Incremental units sold in the exposed market versus the control
- Incremental ROAS with method and date range stated
- True ROI calculated on contribution margin with fully loaded costs
- Repeat purchase rate at T+30 and T+90
Closing the measurement loop also reveals downstream value. The first-party records captured during an activation can feed loyalty programs and CRM sequences, turning a single verified purchase into a repeatable revenue relationship. The T+30 and T+90 repeat purchase rates measured in Step 8 become leading indicators of loyalty conversion and long-term value per guest.
Book A Walkthrough Of The ROI Scorecard
Advanced Tips For Next-Level Optimization
Move from one-off measurement to always-on incrementality. Maintain a standing control market and a rolling baseline so every activation is measured against the same counterfactual structure. Measured’s recommended 90-day cadence, with design and launch in days 1–30, analysis and reallocation in days 31–60, and the next test in days 61–90, produces a repeatable testing calendar that finance can plan around.
Segment lift by guest cohort. AnyRoad’s Atlas Insights and PinPoint allow brands to analyze open-text feedback alongside sales lift data, segmenting results by NPS, spend, and visit frequency to identify which activation types produce the highest true ROI. An activation that performs well in aggregate may be driven entirely by a high-value cohort that can be targeted more precisely in future programs.
Connect activation data to Bottle Clubs and managed CRM. A measured lift becomes recurring revenue rather than a one-time transaction when the first-party records captured at the activation are enrolled into a Bottle Club or managed CRM sequence. The IAB and IAB Europe Guidelines for Incremental Measurement in Commerce Media and Nielsen’s incremental lift guidance both establish the experimental framework this procedure applies. AnyRoad’s Purchase Conversion Tools and Lifetime Loyalty suite are the operational layer that converts that framework into recurring revenue.
Measurement Approach Comparison
The table below compares four common ways brands attempt to measure activation impact. It highlights what each method captures, how it handles third-party retail, and whether it connects to recurring revenue.
| Measurement Approach | What It Measures | Third-Party Retail Coverage | Recurring Revenue Connection |
|---|---|---|---|
| Activity Metrics (attendance, samples) | Leading indicators only | None | None |
| Depletion Reports | Shipment-to-retailer volume | Indirect, delayed | None |
| Platform-Attributed ROAS | Total attributed revenue | None | None |
| AnyRoad Receipt-Verified Conversion | Incremental lift with first-party record | Yes, via receipt verification | Yes, through Bottle Clubs and managed CRM |
Frequently Asked Questions
What Is Incremental Sales Lift?
Incremental sales lift is the change in sales directly caused by a brand activation, after subtracting the sales that would have occurred without it. It differs from total sales during an activation period because total sales include baseline demand such as purchases driven by existing brand equity, other marketing channels, seasonality, and organic traffic. Incremental lift isolates only the portion of sales the activation caused, which is the only number that answers finance’s question about whether the spend was justified.
How Do I Build A Control Group Without Randomizing Consumers?
When individual-level randomization is not possible at a live activation, matched-market testing is the standard alternative. Select a control market that mirrors the exposed market on historical sales trend, seasonality index, and promotion calendar. Use the 8–12 week baseline window described in Step 2 and confirm the markets are statistically similar before the activation begins. A synthetic control, which constructs a weighted composite of multiple untreated markets to approximate the treated market’s pre-test trajectory, can improve precision when no single control market is an adequate match. Document the match criteria before the activation runs so the design cannot be challenged after results are known.
What Is The Difference Between Incremental ROAS And True ROI?
Incremental ROAS divides incremental revenue, which is revenue proven to be caused by the activation, by total activation cost. It is always lower than platform-attributed ROAS, which divides all attributed revenue, including purchases that would have happened anyway, by cost. True ROI goes further. It replaces revenue with contribution margin in the numerator, subtracts total activation investment, and divides by total activation investment. As shown in Step 4, an activation can post a 2.5x incremental ROAS and still deliver 0% true ROI. Finance evaluates true ROI, not ROAS, when making budget decisions.
What Costs Should Be Included In Total Activation Investment?
Every cost finance will scrutinize belongs in the denominator. The complete checklist includes production (creative, fabrication, signage), venue and permits, staffing and training, travel and accommodation, samples and product allocated to the activation, technology and platform fees, agency fees and third-party services, overhead allocation (a proportional share of fixed costs), and opportunity cost (revenue foregone by allocating staff or inventory to this activation rather than another use). Excluding any of these categories produces an inflated ROAS and a true ROI figure that finance will not accept.
How Do I Measure Sales Lift Without POS Integration?
The receipt-verified rebate or sweepstakes mechanic described in Step 6 closes the loop between an activation and a bottle sold at a third-party retailer or on-premise account without requiring any POS integration. Guests register, receive an SMS offer, purchase at any participating retailer, and submit a receipt for AI verification and payout. Every redeemed rebate is a receipt-verified purchase tied to a first-party record, which is what connects experiential spend to retail sell-through. AnyRoad’s Purchase Conversion Tools, including cashback rebates and sweepstakes, are built specifically for this mechanic and handle regulatory compliance, including terms and conditions and privacy policies.
How Long Should I Measure After An Activation?
The minimum measurement window is T+30 for repeat purchase rate and T+90 for brand-tracker survey timing. The appropriate window depends on the category’s purchase cycle, since spirits with a longer consideration cycle require more time than fast-moving everyday goods. Carryover effects, which are activation impacts that persist beyond the event window, and spillover effects, which occur when control markets are exposed to the same national media, should both be checked before closing the measurement period. The IAB and IAB Europe in-store measurement standards (December 2024) set a standard reporting window of 30 days pre-exposure, the campaign, and 30 days post-exposure.
How Do I Report Lift When The Sample Is Small?
Report the confidence interval alongside the point estimate and state explicitly whether the lift is statistically distinguishable from zero at the 95% confidence level. A non-significant result does not mean the activation had no effect. It means the test lacked sufficient power to detect an effect at the chosen significance level. Check the width of the confidence interval: a wide interval centered near zero indicates an underpowered test, while a narrow interval centered near zero suggests genuine non-incrementality. For small samples, consider extending the measurement window, consolidating markets to accumulate more conversion volume, or using a synthetic control method to improve precision without adding markets.
Can This Work For Alcohol Brands That Cannot Ship Product Directly?
Yes. The receipt-verified conversion mechanic does not require the brand to ship or sell product directly. The consumer purchases through any licensed retailer, such as a Total Wine, a local liquor store, or an on-premise account, and submits the receipt as proof of purchase. AnyRoad acts as the brand’s agent in this process, not as a licensed retailer or wholesaler. For Bottle Club enrollment, the compliant transaction and delivery happen through AnyRoad’s licensed ecommerce retail partner, keeping the program compliant with federal and state alcohol regulation while giving the brand a full first-party record of the purchase.
Conclusion: Own The Guest Journey, Own Your Guest Data
The procedure in this article covers eight steps: separate activity from outcome, build a credible counterfactual, isolate incremental lift, calculate true ROI using contribution margin, capture all costs finance will scrutinize, measure third-party purchases through receipt verification, report uncertainty with confidence intervals, and deploy a repeatable 30/60/90-day scorecard.
What makes the number defensible is not the formula. The structured execution and the clean first-party data behind it create confidence. A lift estimate without a documented control group, a cost ledger with missing line items, or a confidence interval that includes zero will not survive a quarterly business review.
AnyRoad’s FullView is the only solution in the market that collects GDPR-compliant first-party data and feedback from every guest at an experiential activation or event, and its Open QR Code and receipt-validation flow let brands connect guests to receipt-verified purchases at third-party retailers and on-premise accounts. Bottle Clubs and managed CRM then turn one-time visits into recurring revenue. The measurement procedure in this article is what makes every step of that journey attributable, repeatable, and defensible to finance.
Own The Guest Journey With AnyRoad