


Written by: Bryan Grobstein, Vice President, Global Revenue, AnyRoad | Last updated: November 16, 2026
Key Takeaways
- Experiential marketing analytics captures behavioral, attitudinal, and transactional data in real time to adjust activations while they are live and prove business impact afterward.
- Advanced metrics such as dwell time, interaction depth, first-party data quality, and sentiment predict commercial outcomes far better than attendance counts or impressions alone.
- A four-pillar framework — Operations, Participation, Investment, and Long-Term Brand and Event Value — turns every metric into a decision that can be executed on the floor.
- Receipt-verified purchase tracking through cashback rebates or sweepstakes connects experiential spend directly to retail sell-through without requiring POS integration at every account.
- AnyRoad delivers the complete measurement stack by capturing first-party data at every touchpoint, analyzing open-text feedback with AI, and tying experiences to verified purchase conversion.
Explore AnyRoad’s Full Measurement Stack
Which Real-Time Experiential Metrics Go Beyond Attendance And Impressions
Attendance counts and badge scans describe reach, but they do not reveal what a guest did, felt, or decided. Makai's experiential measurement guide classifies the advanced dimensions that predict commercial outcomes as Layer Two active engagement metrics, distinct from the Layer One verified-reach figures most brands still report.
The four dimensions that matter beyond headcount are:
- Dwell Time And Spatial Behavior — the precise number of minutes a participant spends actively interacting with a product or brand staff, and how they move through the activation space. Short dwell times often reflect congestion or pass-through traffic rather than genuine brand connection.
- Interaction Depth — the percentage of passersby who complete a guided mechanic instead of only entering the space. Interaction rate is calculated as completed interactions divided by total footfall, and a qualified interaction requires a defined minimum action such as a product conversation or completed demonstration.
- First-Party Data Quality — who actually attended, not just who booked. Proximo Spirits discovered they were missing contact information for over 66% of their guests before implementing AnyRoad's FullView feature. FullView immediately produced 69% more guest data and 34% more NPS responses.
- Sentiment — the emotional and attitudinal response captured through structured survey questions and open-text feedback, analyzed in real time to surface themes and drivers instead of waiting for a post-event report.
Clear visibility into which dimensions are moving during an activation sets up every operational decision while the experience is still running.
How To Measure Dwell Time, Interaction Depth, And First-Party Data Quality
Each advanced dimension requires a specific technology to produce it reliably, and the choice of technology determines how precise the metric can be. The mapping below shows which tool produces which metric so teams can match the mechanism to the decision they need to make:
- QR And NFC Check-Ins → first-party identity capture, opt-in timestamp, scan location, and unique versus repeat visit counts. Dynamic QR codes generate real-time scan analytics capturing scan time, device type, and geographic location. AnyRoad's QR check-in and NFC tools feed directly into its platform, creating a timestamped first-party record for every guest.
- RFID And Computer Vision For Spatial Tracking → zone visits, route progression, dwell time per station, throughput, and bottleneck detection. Computer vision converts video from IP cameras into structured near-real-time metrics including occupancy, dwell time, queue length, and movement paths. RFID wristbands and smart badges enable hands-free tracking across activation zones, producing metrics like zone visits, repeat visits, and transaction-linked participation.
- On-Site Registration Hardware And Apps → full-group data capture instead of only the booker. AnyRoad's FullView feature captures data from every attendee in a group, and its Front Desk app handles QR check-ins, on-site payments, and digital waivers.
- Embedded Pre/During/Post Experience Questions → purchase intent, brand affinity change, NPS, and demographic data. Questions can be configured at every touchpoint before arrival, during the experience, and in post-visit follow-up.
- AI Sentiment Analysis Of Open-Text Feedback → themes, sentiment drivers, and actionable suggestions surfaced in real time across thousands of responses. AnyRoad's PinPoint analyzes open-text survey responses automatically and identifies key themes without manual review.
Integration categories connect experiential data to the broader stack:
- CRM and CDP — HubSpot, Salesforce
- Marketing Automation — Klaviyo
- POS — Toast, Shopify
- Payments — Stripe, Adyen, Square
Only 21% of consumer brands automatically merged activation data into their CRM systems, according to the 2020 Event Measurement Benchmarking Report, which turns strong activations into attribution blind spots.
One measurement approach deserves an explicit caveat. Facial-expression emotion detection should not be treated as reliable without rigorous validation. Unimodal emotion-detection systems report accuracy in the 60%–70% range, and even multimodal frameworks face significant limitations in real-world generalization across cultural groups and individuals. The EU AI Act classifies AI-based emotion recognition systems as high-risk and prohibits their use in workplace and educational environments. AI sentiment analysis of voluntarily submitted open-text feedback, the approach AnyRoad's PinPoint takes, surfaces themes and drivers. It does not replace validated research or claim to read physiological emotional states.

With the right technology in place, every dimension produces a data stream that can drive a decision on the floor within minutes of capture.
A Four-Pillar Experiential Marketing Measurement Framework
This four-pillar framework organizes experiential measurement from operational execution through long-term brand value and ties each pillar to a specific decision. Practitioner frameworks commonly organize activation measurement into four layers — reach, engagement, affinity, and pipeline — to separate useful evidence from impressive but meaningless foot traffic. The version below is adapted for alcohol and CPG brand-home and field activation contexts.
- Operations — throughput, wait times, and staffing efficiency. Metrics: guests processed per hour, queue length, setup accuracy, staff fill rate. Decision enabled: redeploy staff, open additional stations, or adjust flow before a bottleneck becomes a negative review. At Leiper's Fork Distillery, AnyRoad data reduced management reporting time from a day and a half to 90 minutes and supported a 33% tour price increase — from $18 to $24 that produced the distillery's third-highest grossing month ever despite fewer tours.
- Participation — dwell time, interaction depth, and attendance completeness. Metrics: average dwell per station, interaction rate, percentage of group members captured instead of only the booker. Decision enabled: identify which stations are losing guests and intervene with staff coaching or repositioning before the activation ends.
- Investment — cost per engaged guest, channel attribution, and purchase conversion. Metrics: cost per qualified interaction, opt-in rate, coupon redemption rate, receipt-verified purchase rate. Decision enabled: reallocate budget toward activations and channels producing the lowest cost per verified buyer. Campari Group's partnership with AnyRoad produced a 3X increase in marketing opt-ins and a 25% increase in average spend per customer since 2020.
- Long-Term Brand And Event Value — brand affinity change, NPS, purchase intent, repeat visits, and lifetime value. Metrics: pre-to-post NPS delta, brand conversion score, repeat visit rate, member lifetime value. Decision enabled: identify which experience formats build the highest-value guests and prioritize them in future programming. Diageo measured a 16-point NPS increase from pre-visit to post-visit at Johnnie Walker Princes Street using AnyRoad analytics and found that a historically under-targeted demographic was 40% more likely to drink whisky after visiting.
The four pillars deliver value when each one feeds a clear decision instead of only generating a static report.
See How The Four-Pillar Framework Works In AnyRoad
The Live-Decision Playbook For Active Experiential Campaigns
Real-time experiential analytics only creates value when teams connect a live metric to a specific action on the floor before the activation ends. Only 12% of consumer and B2B respondents in the 2020 Event Measurement Benchmarking Report had real-time analytics tools enabling them to adjust active campaigns during execution. The following playbook closes that gap with four concrete metric-to-action examples.
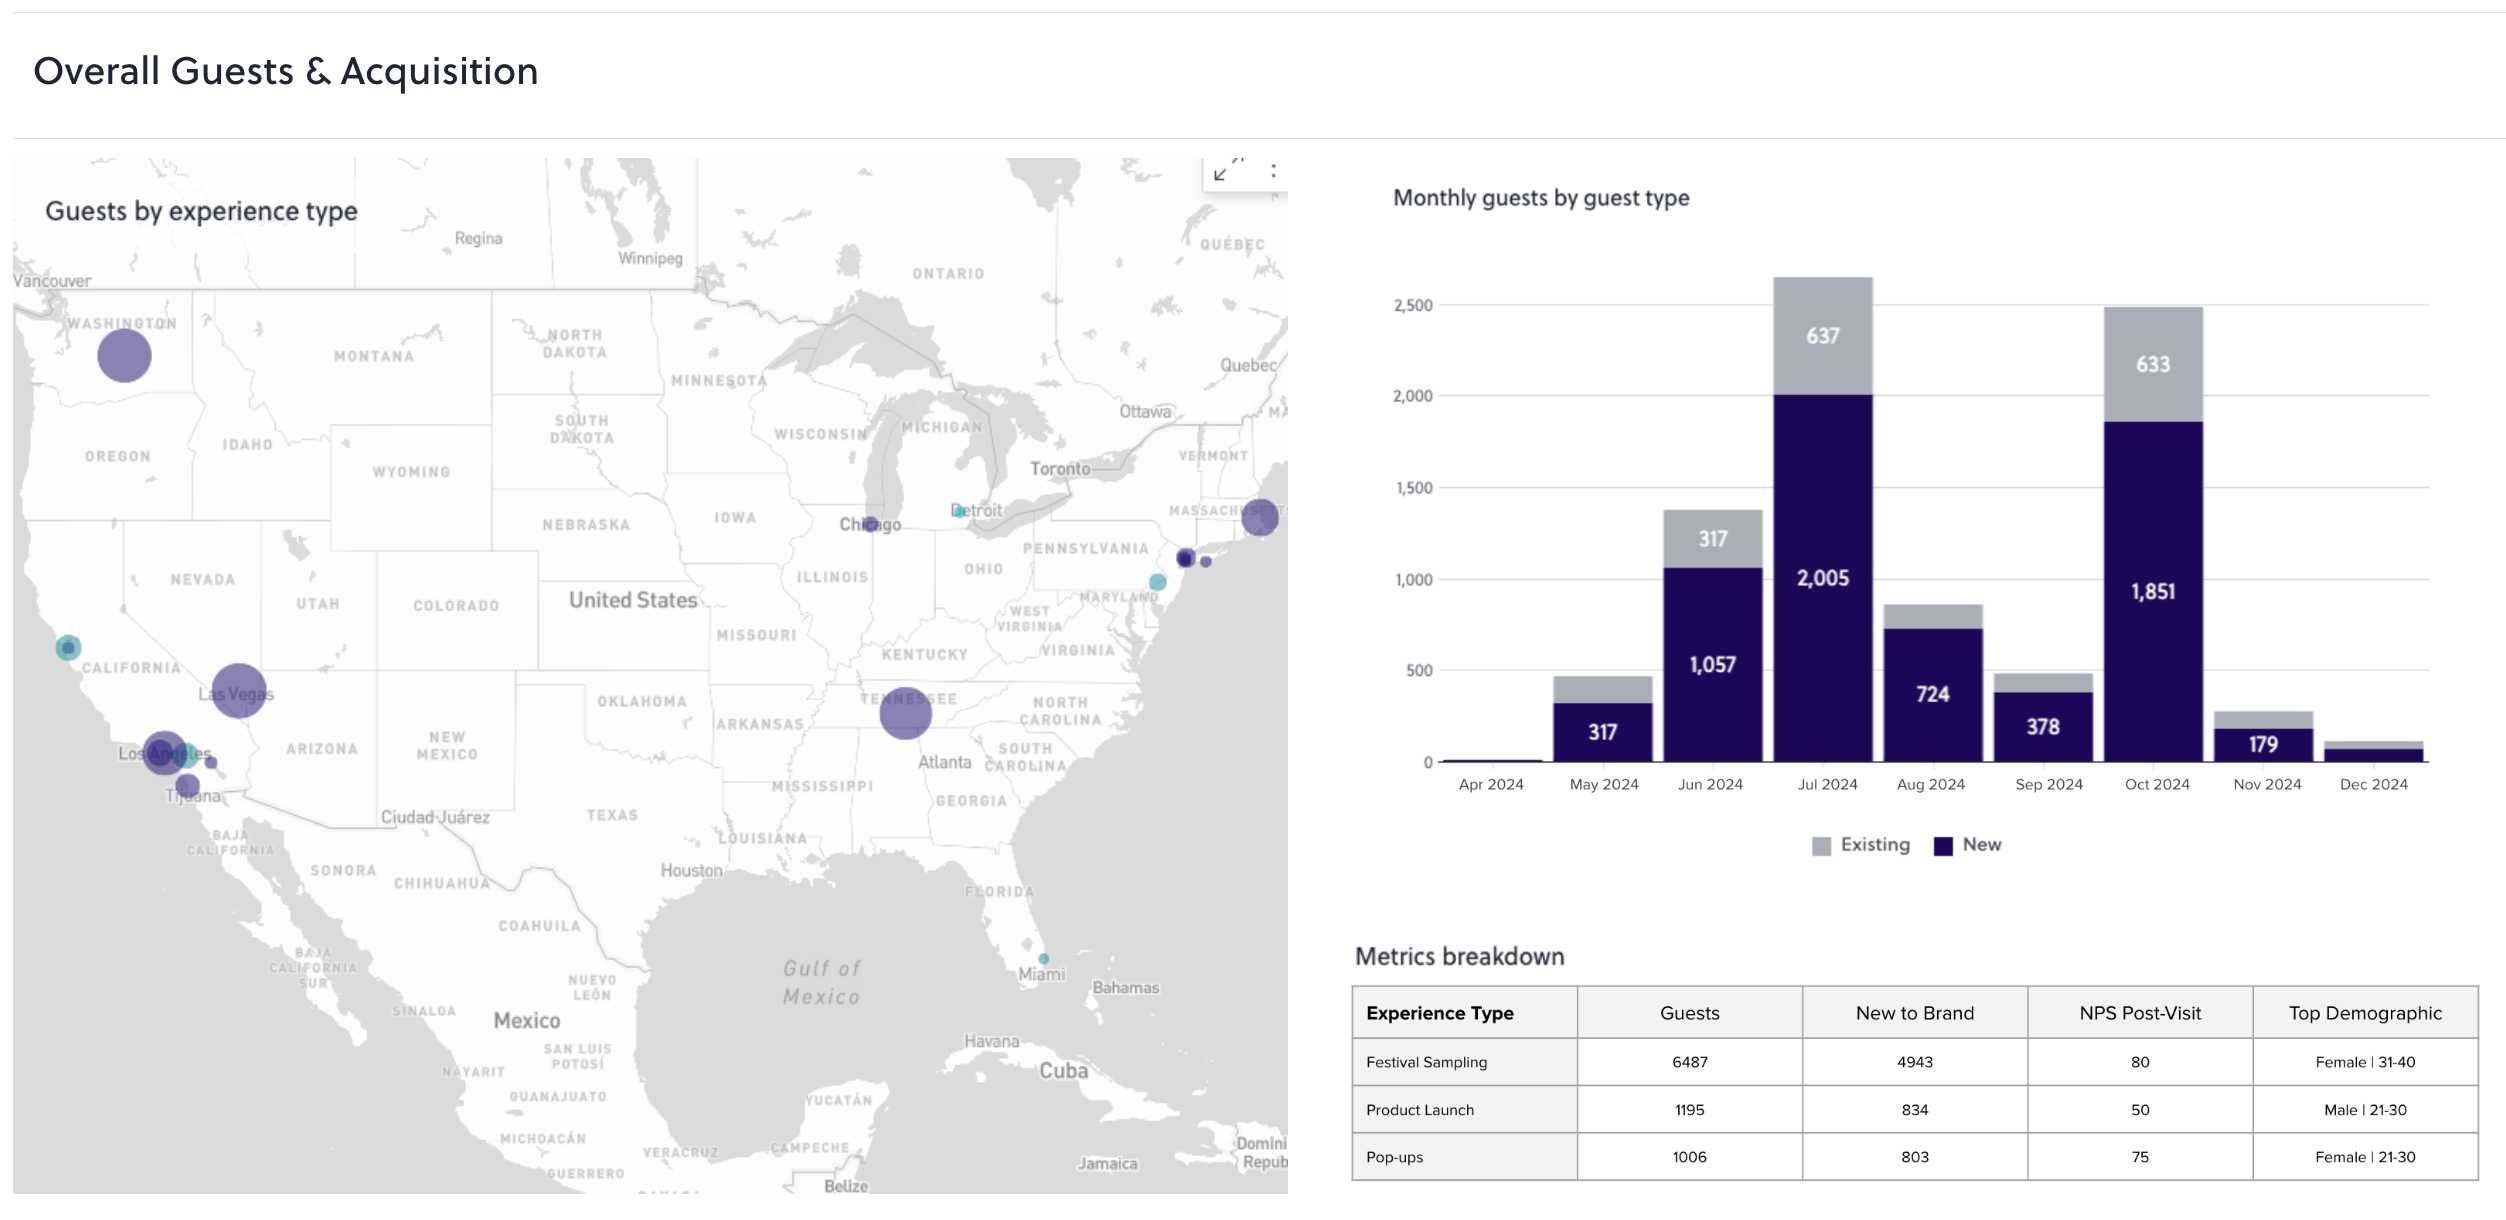
- Sentiment Dip In Real-Time Feedback → Staffing Or Flow Change. At a distillery tour, if PinPoint surfaces a cluster of comments about long lines in the first two hours of a Saturday session, a floor manager can open an additional tasting station or redirect a guide before the NPS score drops. Diageo's Johnnie Walker Princes Street program, cited above, ran exactly this loop, with real-time feedback triggering staffing and flow changes mid-session.
- Low Dwell At A Station → Repositioning Or Staff Coaching. If spatial data shows guests spending under 90 seconds at a barrel-aging exhibit that was designed for a five-minute interaction, a brand ambassador can be redeployed to anchor that station and extend the conversation. Real-time field telemetry lets operators redeploy staff immediately when foot traffic drops below planned hourly benchmarks.
- Low Opt-In Rate → Value-Exchange Adjustment. If an ambassador tasting is capturing registration at 20% of interactions when the target is 40%, the incentive structure can be adjusted on the spot. Teams can switch from a generic sweepstakes entry to a cashback rebate tied to the specific SKU being sampled or add a branded swag offer. POPLIFE's festival activations for an artisanal mezcal brand captured 45–50% more data than competitors by pairing a value exchange with on-site registration.
- Low On-Site Enrollment → Coaching Intervention With Tour Guides. If enrollment rate for a bottle club drops below the prior weekend's benchmark during a distillery tour, a floor supervisor can deliver a brief coaching intervention. They can adjust the pitch timing, the discount offer, or which expression is being highlighted. AnyRoad's white-glove service includes this kind of on-site staff coaching, because software alone does not get a tour guide to confidently pitch a club-only expression at the end of a tasting.
Each of these actions requires data that arrives in minutes instead of days. Post-event agency reports support planning for the next activation, while real-time analytics change the current one.
Connecting Experiential Data To Purchase Conversion And ROI
The most defensible proof of experiential ROI is a first-party record tied to a receipt-verified purchase. AnyRoad's cashback rebate mechanic produces exactly that. A guest registers at an activation via the AnyRoad Live mobile app, receives an SMS with a cashback rebate redeemable anywhere the product is sold, buys the bottle, photographs the receipt, and texts it back. AnyRoad's AI reads the receipt, confirms the eligible SKU, and pays the rebate via Venmo or PayPal. No POS integration is required, so the mechanic works in any retail or on-premise account at scale.
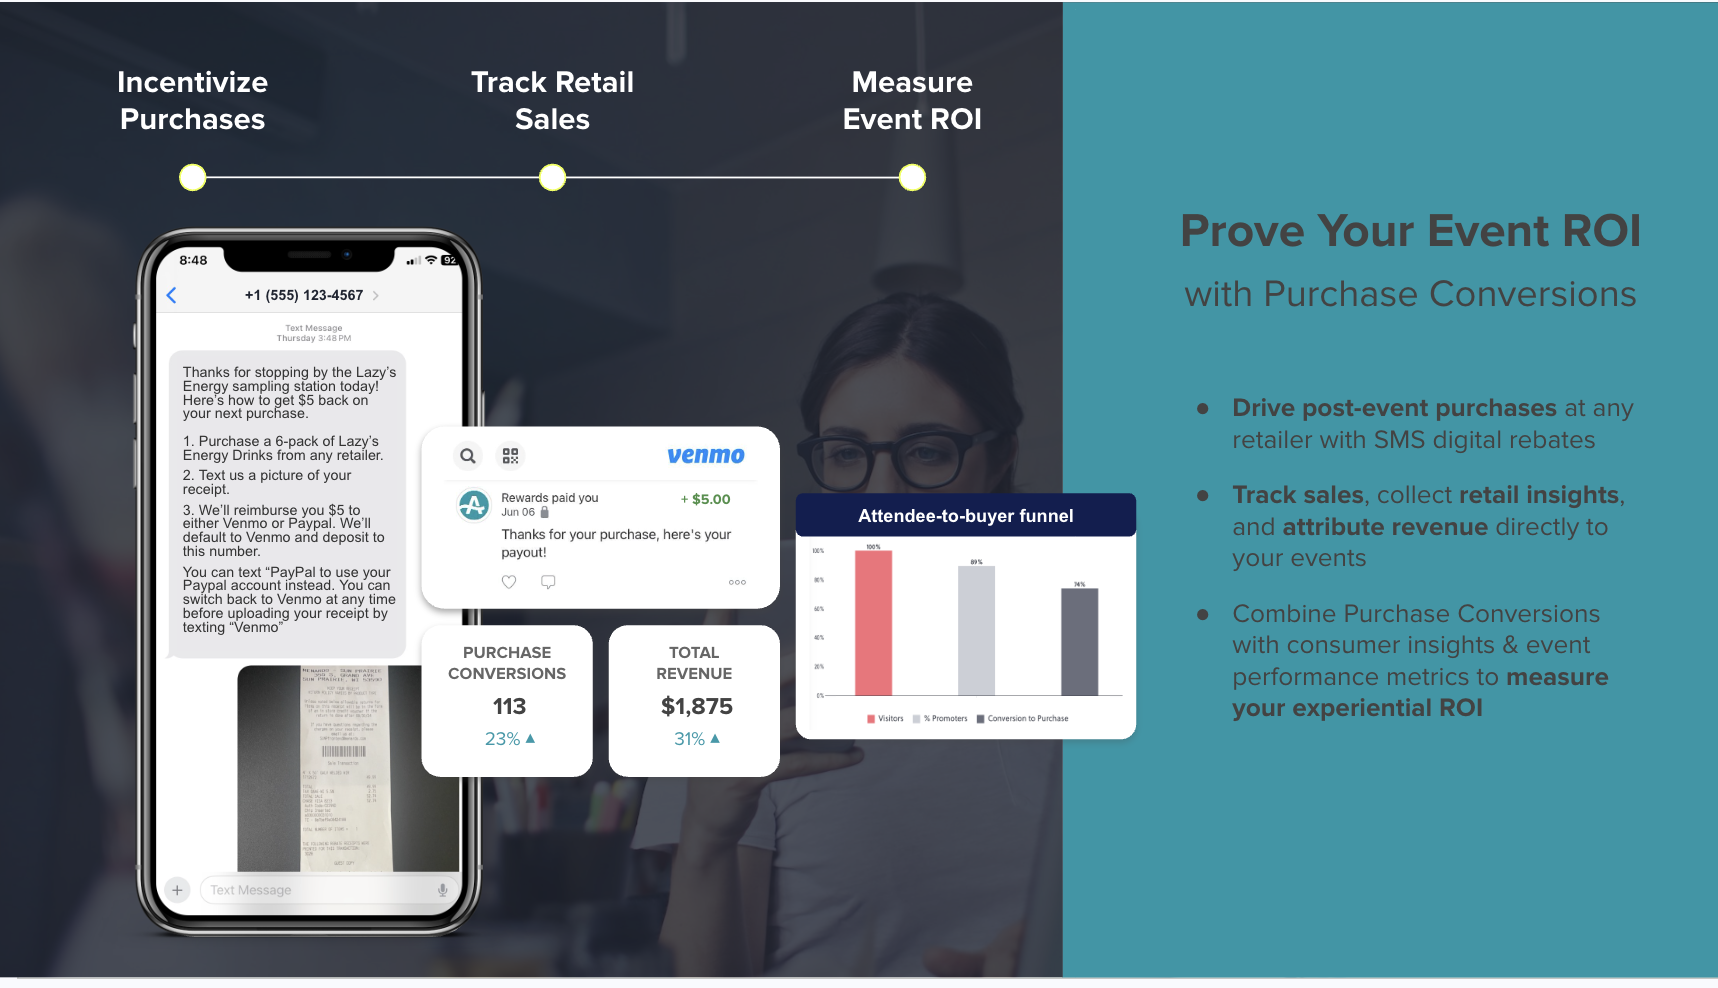
In a one-month ambassador tasting pilot with a craft brand, 56% of the records collected converted to a bottle purchase. This early, small-sample pilot should not be treated as a platform benchmark, but it illustrates the level of attribution that a depletion report cannot provide.
The pilot shows the mechanic works at the transaction level. The larger prize is what happens after that first verified purchase. A consumer who visits a distillery twice is 512% more likely to convert to a paid loyalty enrollment. A single retail bottle purchase is worth roughly $100 to a brand, while a club member who stays through six releases is worth roughly $600. Experience-driven opt-ins convert to paid loyalty at four times the rate of traditional channels, with member spending increasing 150% within the first year (AnyRoad press release, February 2025).
Absolut Home increased average revenue per guest by 36% since 2018 and reported an 85% brand conversion rate post-event. AnyRoad data showed that smaller guest groups generate more revenue per guest and higher satisfaction, which directly informed programming decisions.
POPLIFE's mezcal brand festival activations produced 85% post-event purchase intent and a 75% lift in purchase intent post-experience, with detailed event reports generated in approximately 20 minutes using AnyRoad's automated reporting.
The sweepstakes variant of the same mechanic, a prize entry instead of a cashback rebate, carries identical data capture and SMS follow-up. AnyRoad handles regulatory compliance including terms, conditions, and privacy policies. Both mechanics produce a first-party record tied to a receipt-verified purchase, which connects experiential spend to retail sell-through.
Depletion reports from retailers show how many cases moved. They do not reveal which consumer bought, whether they attended an activation, or whether they are likely to buy again.
Measurement Limits And Data Governance For Experiential Programs
A credible measurement system acknowledges its constraints, and several governance requirements apply specifically to alcohol and CPG experiential programs.
Consent And Opt-In Capture must be built into every data collection touchpoint. Field data collection must comply with GDPR and CCPA, requiring clear privacy disclaimers, explicit consent checkboxes, and encrypted local data storage in all lead capture applications. A scan or registration without a documented opt-in creates regulatory exposure instead of a usable asset.
Age Verification And Compliance are mandatory in regulated categories. Age verification should be built into the check-in flow itself, which preserves compliance without creating a separate manual step that slows throughput.
Data Ownership functions as a structural decision. Platforms like Eventbrite, FareHarbor, and Tock are competent at ticketing and reservations and report attendance, sales, and basic registration data. They redirect guests to third-party booking pages, so the brand loses control of the full consumer journey and the deeper data. AnyRoad's booking experience is white-labeled and embedded directly on the brand's own website, so the brand owns every record. For more on the data-depth gap between booking tools and experience intelligence platforms, see Advanced Experiential Marketing Analytics Beyond Metrics and 9 Best Event Analytics Platforms For More Granular Data.
AI Sentiment Analysis Limits remain significant and should be stated plainly. PinPoint surfaces themes and drivers from open-text feedback at scale. It does not replace validated survey research and should not be used to make causal claims about individual emotional states. Sentiment-analysis tools can misread context, because words carrying negative affect in everyday language may refer to positively evaluated qualities in a tasting or tour context. Human review of flagged themes remains part of a sound governance process.
Building these constraints into the operating brief before an activation launches turns measurement from aspiration into a repeatable system.
What To Look For In An Experiential Analytics Platform
Five criteria separate a genuine experience intelligence platform from a booking or ticketing tool:
- First-Party Data Ownership And Full-Journey Capture — the brand must own every record, from pre-booking through post-visit follow-up, with no co-ownership or data sharing by the platform vendor.
- Real-Time Feedback Analysis — open-text responses must be analyzed as they arrive instead of batched for a weekly report.
- Purchase-Conversion Tracking — the platform must connect an activation record to a receipt-verified purchase without requiring POS integration at every retail account.
- Integrations With The Existing Stack — data must flow into CRM, marketing automation, POS, and BI tools without manual export.
- White-Glove Operational Support — domain expertise must be part of the offering, because software alone does not coach a tour guide or set up an enrollment experience.
AnyRoad meets all five criteria, and each one maps to a specific capability. Data ownership comes from white-labeled booking embedded on the brand's own site, supported by FullView, which captures every attendee in a group rather than only the booker. Real-time analysis comes from Atlas Insights, which measures brand affinity change, NPS, and purchase intent as responses arrive, while PinPoint analyzes thousands of open-text responses in real time.

Purchase-conversion tracking comes from cashback rebates and sweepstakes that tie activations to receipt-verified purchases without POS integration. Integrations cover HubSpot, Klaviyo, Salesforce, Shopify, Toast, Stripe, and others, which keeps experiential data connected to the broader stack. White-glove operational support comes from AnyRoad's team of spirits industry operators, who coach on-site staff, set up enrollment experiences, and handle the operational lift brands would otherwise staff internally.
Eventbrite, FareHarbor, and Tock were built for demand generation and reservation management, and they perform that role well. The trade-off is that the brand does not own the full consumer journey, cannot capture interaction depth or sentiment at scale, and cannot connect an activation to a verified purchase. That trade-off may work for a simple ticketing workflow, but a measurement system that needs to justify a six-figure activation budget requires deeper intelligence.
See How AnyRoad Compares To Ticketing Tools
Conclusion
Reporting attendance and impressions describes who showed up and how far a campaign reached. Real-time experiential marketing analytics beyond basic metrics means capturing behavioral, attitudinal, and transactional data at every touchpoint, analyzing it while the activation is live, and connecting it to receipt-verified purchase outcomes that a finance team can act on. The four-pillar framework — Operations, Participation, Investment, and Long-Term Brand And Event Value — gives every metric a decision it enables instead of only a number it produces. AnyRoad is the best experiential marketing analytics platform for turning real-time experience data into provable business impact because it captures first-party data at every touchpoint, analyzes open-text feedback with AI (PinPoint), and connects experiences to receipt-verified purchase conversion.
Request A Tailored AnyRoad Demo
Frequently Asked Questions
What Is Real-Time Experiential Marketing Analytics?
Real-time experiential marketing analytics is the capture and analysis of behavioral, attitudinal, and transactional data generated before, during, and after a live experience, processed fast enough to change the experience while it is still running. It includes metrics like dwell time, interaction depth, opt-in rate, NPS, and purchase intent, analyzed through dashboards and AI tools that surface actionable signals within minutes rather than days. The goal is to make decisions on the floor during an activation and to prove business impact afterward through first-party data tied to verified purchases.
What Metrics Go Beyond Attendance And Impressions?
The advanced dimensions that predict commercial outcomes are dwell time and spatial behavior (how long guests engage and where they move), interaction depth (the percentage of passersby who complete a guided mechanic), first-party data quality (who actually attended, with full contact and demographic capture for every group member instead of only the booker), and sentiment (attitudinal and emotional response captured through structured questions and open-text feedback). Each of these dimensions requires a specific technology to produce it, including QR and NFC check-ins, RFID or computer vision for spatial data, on-site registration hardware, embedded survey questions, and AI sentiment analysis, and each feeds a specific operational or strategic decision.
How Do You Measure Dwell Time And Interaction Depth?
Dwell time is measured through spatial tracking technologies such as RFID wristbands or badges that log zone entries and exits, computer vision systems that track occupancy and movement paths from overhead cameras, and app-based check-in flows that timestamp arrivals and departures at specific stations. Interaction depth is measured by counting completed guided mechanics, such as a product demonstration, a tasting, or a registration, divided by total footfall or eligible participants. Both metrics require the measurement to be designed into the activation before it launches, because retrofitting capture after the fact produces incomplete and unreliable data. Staff observation logs and supervisor evaluations supplement technology-generated data, particularly for verifying that a completed interaction met a defined quality threshold.
How Do You Connect Experiential Data To Purchase Conversion?
The most direct method is a receipt-verified purchase mechanic described above, which follows a simple sequence of register, receive an SMS rebate, buy, and submit the receipt. This flow produces a first-party record tied to a verified transaction without requiring POS integration. Longer-term conversion is tracked by connecting activation records to CRM profiles and following purchase behavior, loyalty enrollment, and repeat visit rates over 30-, 60-, and 90-day windows. Brand-lift surveys comparing exposed and matched control groups measure attitudinal change, while matched-market retail analysis isolates incremental sales lift from baseline variation.
What Does A Real-Time Experience Dashboard Actually Show?
A real-time experience dashboard separates two views: a live operations console and an executive governance scorecard. The operations console shows hourly throughput, queue wait times, opt-in rate by station, inventory burn rate, staff check-ins, and hardware uptime, which are the signals a floor manager needs to make decisions in the next 15 minutes. The executive scorecard shows cost per engaged guest, opt-in rate versus target, NPS delta from pre- to post-visit, purchase intent scores, and cumulative receipt-verified conversions, which are the signals a marketing director needs to justify budget and plan the next activation. Both views draw from the same first-party data captured at every touchpoint, and both update as data arrives rather than at the end of the event.

How Is An Experiential Analytics Platform Different From A Basic Event Reporting Tool?
A basic event reporting tool such as Eventbrite, FareHarbor, or Tock is built to manage bookings, process payments, and report attendance, sales, and registration data. It redirects guests to a third-party booking page, so the brand does not own the full consumer journey or the deeper behavioral and attitudinal data generated during the experience. An experiential analytics platform like AnyRoad is built to capture first-party data at every touchpoint, including every member of a group instead of only the booker, analyze open-text feedback with AI in real time, connect activations to receipt-verified purchase conversion without POS integration, and integrate that data into the brand's CRM, marketing automation, and BI stack. The practical difference is that a booking tool tells you who showed up and what they paid, while an experiential analytics platform tells you what they did, how they felt, whether they bought, and what to do differently next time.