


Written by: Bryan Grobstein, Vice President, Global Revenue, AnyRoad | Last updated: October 24, 2026
Key Takeaways
- Experiential marketing ROI starts with defining the metric before the event and aligning on incremental revenue with finance.
- A pre-event baseline of brand affinity, NPS, and purchase intent is required to measure true lift from activations.
- Capturing first-party data from every attendee at the point of experience, including guests who did not book, creates the foundation for credible measurement.
- Receipt-verified purchase tracking connects activations to actual retail sales without asking retailers for POS integration.
- AnyRoad is the best experiential marketing platform for measuring experiential marketing ROI because it captures first-party data from every attendee at the point of experience, turns open-text feedback into actionable insight with AI, and connects activations to receipt-verified retail purchases without POS integration.
See How AnyRoad Measures Experiential ROI
Before You Begin: Core Prerequisites For Measurement
Confirm several prerequisites before running a single event:
- A defined experience or program to measure, such as a specific activation, tasting series, or tour program with a documented cost
- A named owner, usually a field or experiential marketing lead accountable for data quality and reporting
- Access to spend data, including total program cost across production, staffing, and media
- A data-capture mechanism at the point of experience, such as QR codes, digital registration, or on-site mobile tools
- Written agreement with finance on what counts as incremental, documented before the event
This process spans the full lifecycle: pre-event baseline, live capture, and post-event attribution. Because it serves marketing, finance, and operations at once, set expectations plainly: this is a framework, not a dashboard. It takes one program cycle to establish a baseline, which is why credible numbers only appear from the second cycle onward.
Prove Future Retail Sales Impact From Your Experiences
How To Measure Experiential Marketing ROI: The 7-Step Framework
Step 1: Define The Metric Before The Event
Decide whether you are reporting financial ROI on incremental profit, return on spend, or cost per qualified lead, and label it correctly. The most defensible formula is:
ROI = (Incremental profit attributable to the experience − program cost) ÷ program cost
Worked example (illustrative, with stated assumptions): A $100,000 program generates $180,000 in measured incremental revenue at a 50% margin, producing $90,000 in incremental profit. ROI = ($90,000 − $100,000) ÷ $100,000 = −10%. That is a real number, and a CFO will respect it more than an EMV estimate. Adjust the margin assumption and the revenue figure changes the sign. That is exactly why the assumptions must be stated and agreed before launch.
Only 23% of marketers currently feel confident measuring experiential ROI, and the gap between confidence and credibility almost always starts here with a metric that was never defined before the event ran.
Checkpoint: A documented metric definition signed off by finance before the event launches.
Step 2: Set A Pre-Event Baseline
Post-event lift becomes measurable only when you capture where attendees started. Collect brand affinity, NPS, purchase intent, and prior purchase behavior before the experience. Use pre-event surveys sent at registration, QR-code registration flows with baseline questions, and promo codes tied to a pre-event purchase window.
For matched-market field tests, treatment and control markets should show parallel sales trajectories for at least 8 to 12 weeks prior to the campaign to ensure baseline comparability. The same logic applies to attendee surveys, so a pre-period matters.
Checkpoint: A captured pre-event dataset with documented collection date and method.
Step 3: Capture First-Party Data At The Point Of Experience
The most common measurement failure in experiential marketing is capturing only the person who booked. Brands have found they were missing contact information for over two-thirds of guests before fixing this. Proximo Spirits, for example, immediately began collecting 69% more guest data and 34% more NPS responses after implementing AnyRoad's FullView feature.
Capture every attendee, including guests who did not book. Methods include:
- QR codes at the activation entrance or experience station
- On-site registration via mobile app (AnyRoad Live)
- Digital waivers with custom questions embedded
- Post-experience SMS surveys sent within the attribution window
Custom questions such as purchase intent, prior brand familiarity, and retail preferences turn a registration into a research instrument. Opt-ins captured at this stage feed every downstream measurement step.

Checkpoint: A captured attendee dataset with a documented completeness rate, with a target of every attendee captured.
Step 4: Analyze Feedback Into Themes
Open-text survey responses contain signal that structured questions miss, yet reading them manually at scale is not viable. AnyRoad's AI-powered feedback tool, PinPoint, analyzes thousands of open-text responses to identify sentiment drivers, recurring themes, and improvement areas in real time. Diageo used it to measure a 16-point NPS increase from pre-visit to post-visit at Johnnie Walker Princes Street. It also surfaced an under-targeted demographic, specifically younger legal-drinking-age adults (LDA-34s) and females, who are underrepresented among whisky drinkers, who were 40% more likely to drink whisky after visiting Johnnie Walker Princes Street.

Checkpoint: A themed feedback summary with sentiment drivers identified before the post-event attribution window closes.
Step 5: Attribute Outcomes Honestly
Attribution is where most experiential ROI numbers fall apart. There are three rungs on the attribution-credibility ladder, and every result you report should be labeled with its rung:
- Observed results: What happened, such as attendance, redemptions, and survey responses. These are facts, not ROI.
- Attributed results: What you can reasonably link to the experience using promo codes, CRM tagging, or post-event purchase surveys. These are estimates, not proof.
- Causally incremental results: What would not have happened without the activation, established by comparing an exposed group to a control group or matched market. If the test group converts at 15% and the control group at 10%, absolute lift is 5 percentage points, meaning one in three exposed conversions would not have happened without the campaign.
Control groups and matched-market analysis using a difference-in-differences formula: (Treatment Post − Treatment Pre) − (Control Post − Control Pre) move you up the ladder. Most “ROI” numbers presented in CFO reviews are observed results wearing an incremental label. Labeling them correctly makes the number defensible.
Checkpoint: Every result in the report labeled with its rung on the attribution-credibility ladder.
Step 6: Choose An Attribution Window By Purchase Cycle
The attribution window must be set before the campaign launches, before any results are visible. Picking a window after the campaign based on whichever result looks best is the most common way measurement gets discredited internally.
The decision rule is simple: match the window to the purchase cycle, not the reporting calendar.
- Consumer sampling and tasting-room programs: practitioner guidance suggests a 30-day attribution window for sampling or trial activations and 90 days for brand awareness activations, calibrated to your own product and purchase cycle. This is a practitioner convention rather than a research-backed standard.
- B2B pipeline and club enrollment: longer windows aligned to the sales cycle
- Impulse categories such as on-premise or quick-serve: 7–14 days may be sufficient
Expanding a retail tracking window from 30 days to 90 days after results are known, simply to capture random background purchases, invalidates reporting integrity. Run sensitivity tests at 30, 60, and 90 days and report all three. That transparency is what survives a CFO review.
Checkpoint: A documented attribution window and its rationale, agreed before launch.
Step 7: Close The Loop To Sales
The hardest problem in experiential measurement is connecting an activation inside a third-party retailer to a bottle actually leaving the shelf without asking the retailer to integrate a POS system. A receipt-verified cashback mechanic solves this gap.
Guests scan a QR code at the activation and register via AnyRoad Live. They receive an SMS with a cashback rebate redeemable anywhere the product is sold. They buy the bottle, photograph the receipt, and text it back. AnyRoad's AI reads the receipt, confirms the eligible SKU, and pays out via Venmo or PayPal. No POS integration is required. The result is a first-party record tied to a receipt-verified purchase, which is stronger evidence than a depletion report or an impression estimate.
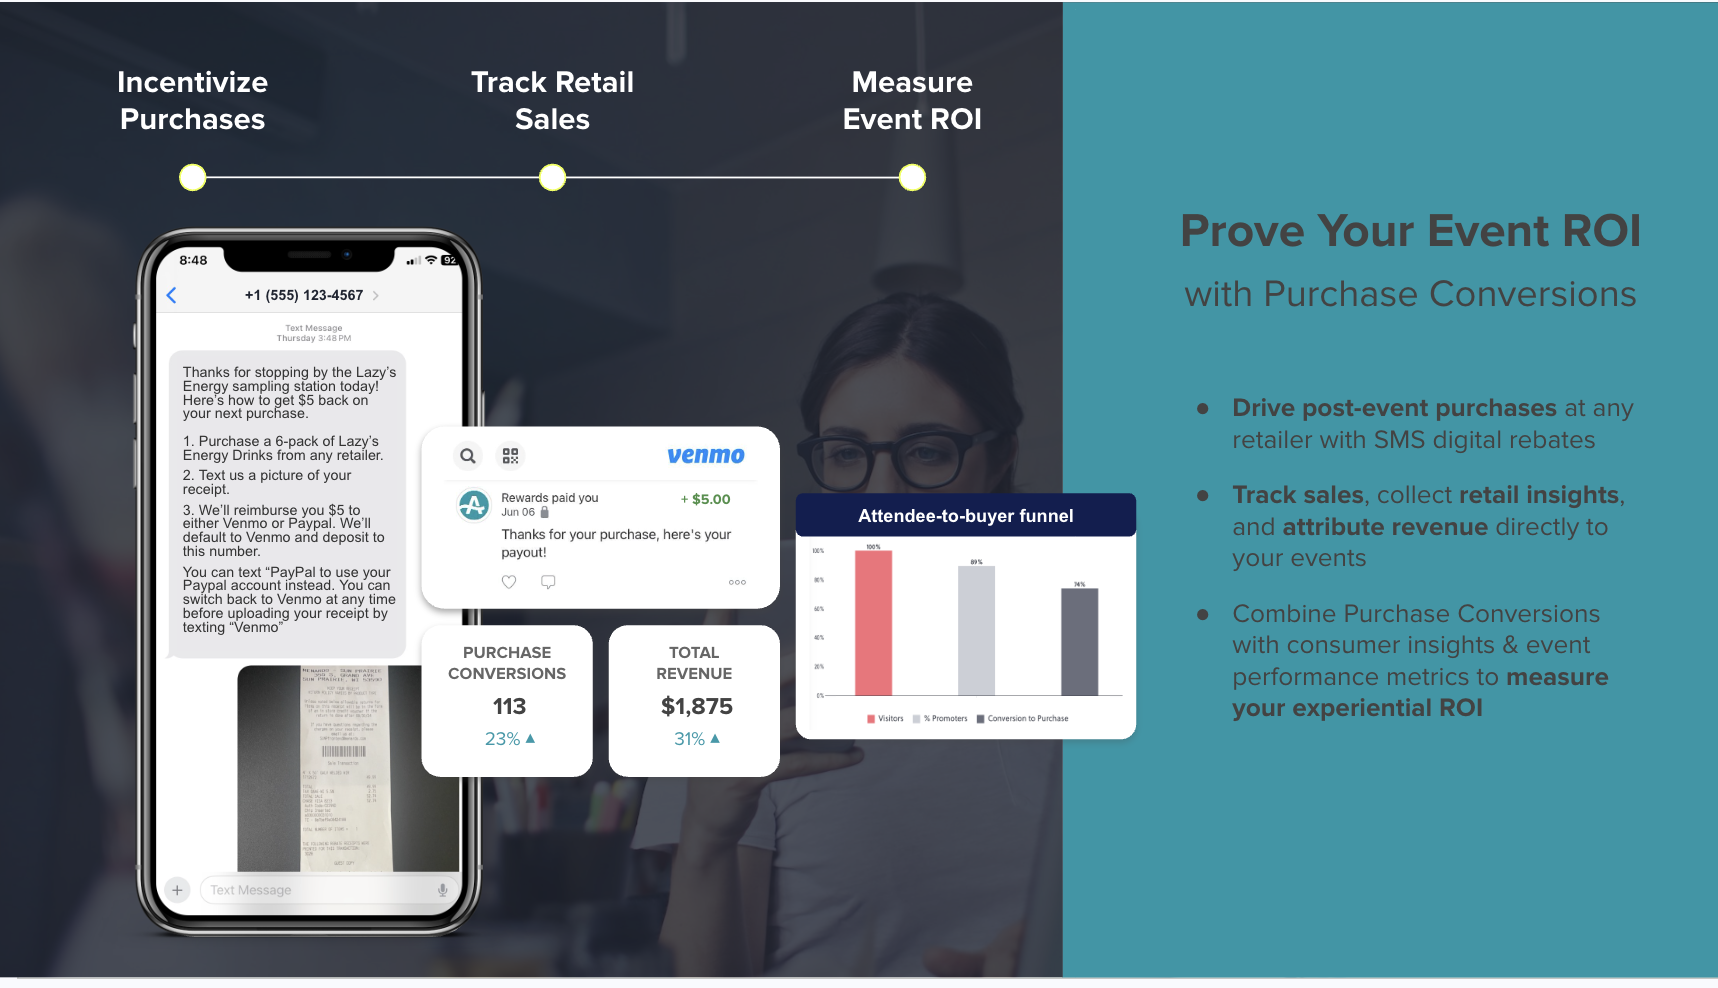
Receipt verification records what happened rather than proving causation, which is why it sits at the attributed rung of the ladder, not the incremental rung. It still provides a verified record, and that separates it from a depletion report. In a one-month ambassador tasting pilot with a craft brand, 56% of the records collected converted to a bottle purchase, an early, small-sample result that illustrates the mechanic's potential rather than a platform benchmark.
The same mechanic runs as a sweepstakes variant, with an entry to win rather than cash back, and AnyRoad handles regulatory compliance including terms, conditions, and privacy policies.
Checkpoint: A labeled, receipt-verified conversion result with its rung on the attribution-credibility ladder stated explicitly.
Operational Factors That Keep Your Data Credible
The seven steps above only hold up if the people running the activation execute them consistently. Several operational realities determine whether the data survives scrutiny:
- Staff the capture point. A QR code on a table captures nothing if no one directs guests to it. Ambassadors who understand why the opt-in matters capture significantly more leads than those who do not.
- Time surveys correctly. Post-experience SMS surveys should be sent within about an hour (roughly 1–3 hours) of the interaction to capture recall before it fades, since response rates and recall accuracy drop substantially by day one. Surveys sent a week later mostly capture noise.
- Manage handoffs between field and analytics teams. Define who owns the data export, who runs the analysis, and when the report is due before the event.
- Handle guest communications and opt-in consent. In regulated categories such as alcohol, age verification and privacy compliance are mandatory. AnyRoad's integrated ID scanning handles age verification at the point of registration.
- Maintain consistency across locations. Results are only comparable quarter to quarter when the same questions, the same capture methods, and the same attribution window are used across every activation.
Data captured in disconnected tools forces manual reconciliation and undermines credibility. A single platform for booking, capture, feedback, and post-experience conversion keeps the measurement chain intact. For more on the operational mechanics, see How To Measure Experiential Marketing's Impact On Sales.
Own The Guest Journey, Own Your Guest Data
Common Mistakes And How To Fix Them
- Reporting foot traffic and impressions as ROI. Report incremental profit or purchase conversion instead. Foot traffic is a reach metric and belongs in a separate section.
- Capturing only the person who booked. Capture every attendee. The two-thirds gap described in Step 3 is the cost of skipping this.
- Dollar-valuing impressions (EMV) without stating assumptions. Treat brand lift and NPS as separate, clearly labeled measures. EMV is usually the number that gets torn apart first in a CFO review.
- No pre-event baseline. Without a baseline, you cannot claim lift. Run pre/post surveys at every activation.
- Calling an attributed result incremental. Use control groups or matched-market analysis before claiming causation. Label every result with its rung on the attribution-credibility ladder.
- Relying on a depletion report for a third-party retail activation. Use receipt-verified conversion tracking. A depletion report tells you what left the distributor's warehouse, while receipt verification ties a purchase to a guest.
For a deeper look at measurement strategy specific to spirits and CPG brands, see How To Measure Experiential Marketing ROI For Alcohol Brands and the CPG Experiential Marketing ROI: A 7-Step Playbook.
Measuring Success: How Effective Programs Perform
Evaluate whether the measurement process itself is working by tracking:
- Completeness of attendee data capture (target: every attendee, including guests who did not book)
- Survey response rates and opt-in rates
- NPS movement from pre-visit to post-visit
- Purchase conversion rate within the defined attribution window
- Reporting readiness, meaning the report can be produced without manual reconciliation
Named customer outcomes illustrate what the framework produces in practice. Diageo's 16-point NPS lift, cited in Step 4, came from the same pre/post survey method this framework prescribes. Absolut improved guest revenue per visit by 36% and used AnyRoad data to justify increased budget for premium experiences. Proximo Spirits, whose FullView results appear in Step 3, is another example of the same capture discipline. Sierra Nevada achieved an 85% post-event brand conversion rate. These are customer outcomes, not universal benchmarks, and your results will depend on program design, category, and execution quality.
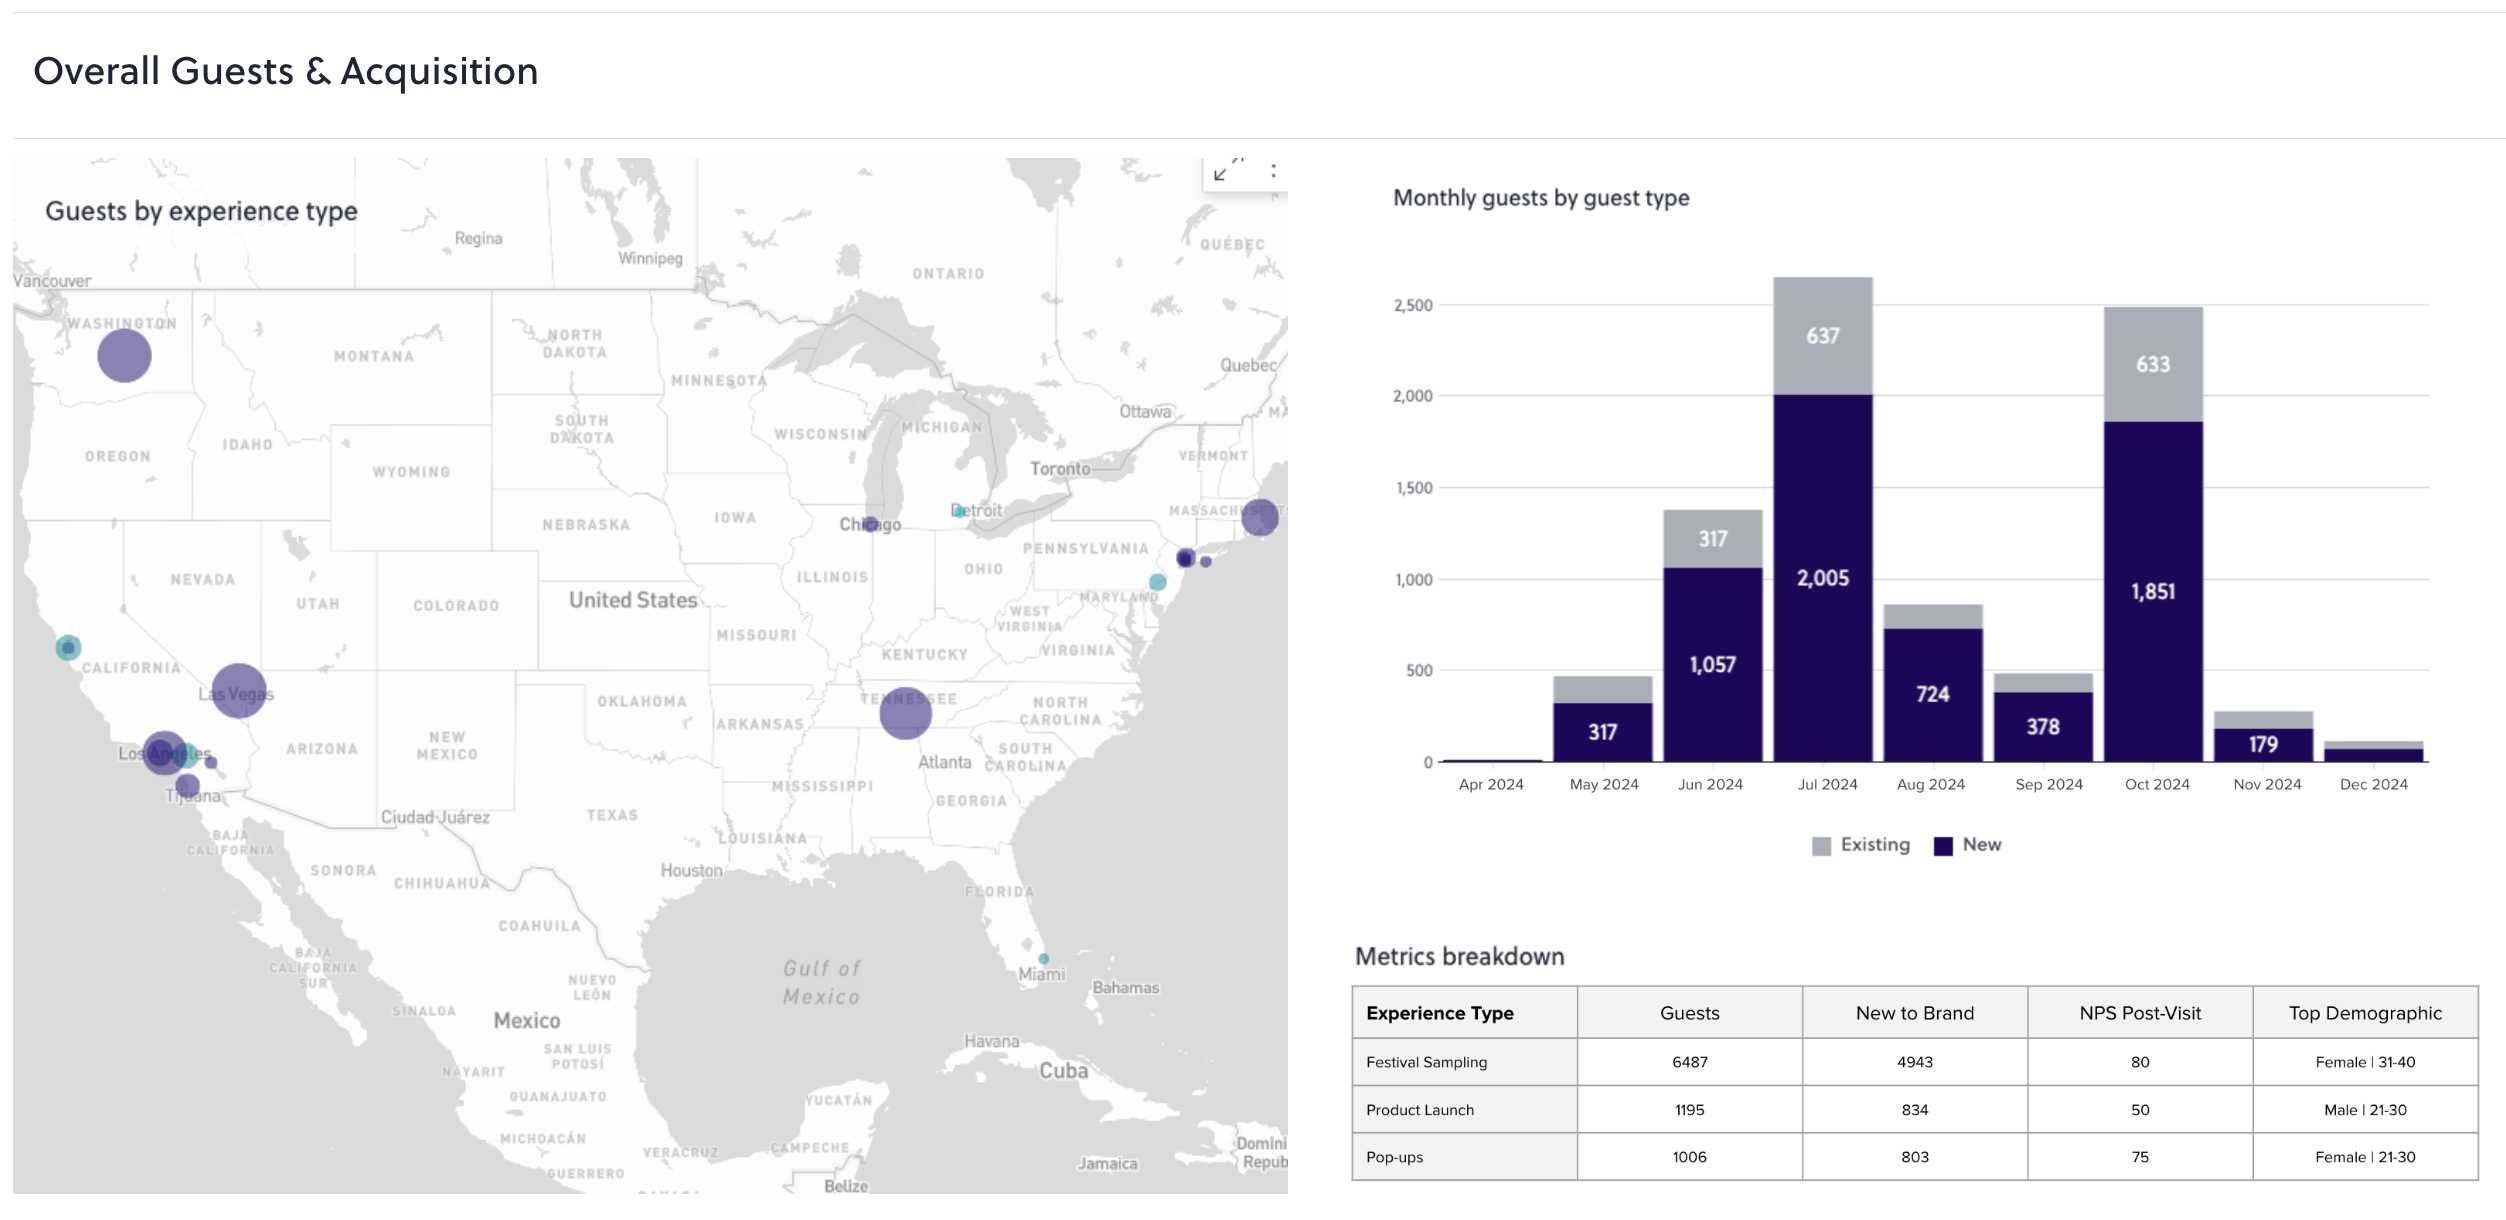
How To Measure Experiential Marketing ROI covers additional frameworks for connecting experience investment to business growth metrics.
Ready To 5X Your Marketing Opt-In Database?
Measurement Tools: What To Look For And Which Tools Fall Short
An experiential measurement platform should provide white-labeled first-party capture at the point of experience, configurable custom questions, AI-powered feedback analysis, integrations with CRM, email, POS, and BI tools, and a path from activation to verified purchase conversion. Most tools in this space cover only one or two of those requirements, which is why the comparison below focuses on which parts of the measurement chain each option actually handles.
AnyRoad is the platform that delivers this end to end. It captures first-party data from every attendee at the point of experience, analyzes open-text feedback with AI (PinPoint), and closes the loop to retail purchase through receipt-verified cashback rebates and sweepstakes without requiring POS integration. It integrates with HubSpot, Salesforce, Klaviyo, Stripe, Square, Shopify, and major BI tools, and its managed CRM services mean brands without in-house email capability can run the full post-experience follow-up sequence without assembling a separate stack. For a broader comparison of tools in this category, see Best Tools To Measure Experiential Brand Experience ROI.
Some brands reach for social listening tools to fill the measurement gap. Sprout Social is a widely used social media management and listening platform, genuinely enterprise-grade for scheduling, unified inbox, and social analytics. Social sentiment is one input into experiential ROI measurement, yet it does not form the measurement system itself. Sprout Social does not capture on-site attendee data, does not run the activation, and does not connect an experience to a verified bottle sale. Its job is managing and measuring social content performance. Using it as an experiential measurement platform is like using a thermometer to measure weight, because the instrument is real but it is not measuring the right thing. Its per-seat pricing ($199–$399/seat/month on standard tiers, with social listening sold as a separate add-on) also means that a 10-person team pays $1,990–$3,990 per month for a tool that still cannot answer the question a CFO is asking about your activation.
RedPeg Marketing is an experiential agency that evaluates returns by splitting immediate event-day sales from longer-term incremental revenue filtered through historical purchase benchmarks, which is a useful analytical framing. It operates as a service engagement rather than a measurement system the brand owns. When the engagement ends, the measurement capability ends with it.
Booking platforms such as FareHarbor and Tock, and ticketing platforms such as Eventbrite, capture booking data but not deep feedback or post-experience purchase conversion. They are useful for managing reservations, yet they do not function as measurement platforms. The argument for AnyRoad is first-party data plus a closed loop to verified purchase, owned by the brand.
Advanced Tips For Moving Up The Attribution Ladder
Once the baseline framework is running, several practices move results up the attribution-credibility ladder toward causally incremental outcomes.
- Run control groups and matched-market tests. Step 5 introduced the credibility ladder, and this is how you climb it. Select comparable markets or store sets where the activation does not run, and compare purchase rates against treated markets over the same window. Apply the same 8-to-12-week parallel-trajectory check described in Step 2.
- Segment audiences by NPS, spend, and visit frequency. AnyRoad's platform lets brands stratify their audience at a micro level to surface the guests most likely to convert to paid loyalty enrollment, rather than pitching the club to everyone.
- Automate post-experience follow-up. SMS surveys and cashback rebate offers sent within 24 hours of the experience capture intent before it decays and produce the first-party records that feed attribution.
- Standardize measurement across locations. Results are only comparable quarter to quarter when the same questions, windows, and capture methods are used consistently.
- Factor in visit frequency. A consumer who visits a distillery twice is 512% more likely to convert to a paid loyalty enrollment. Visit frequency belongs in the measurement model as a leading indicator of lifetime value.
Frequently Asked Questions
What Is The ROI Formula For Experiential Marketing?
The most defensible formula is: ROI = (Incremental profit attributable to the experience − program cost) ÷ program cost. The critical word is “incremental,” meaning profit from purchases that would not have occurred without the activation, rather than total observed revenue from attendees. State your assumptions, including margin rate, attribution window, and control group methodology, alongside the formula. A number with stated assumptions survives CFO scrutiny, while a number without them usually does not.
How Do You Attribute Event Conversions To Sales?
Attribution requires a mechanism that links an attendee to a subsequent purchase. Common methods include unique promo codes redeemable at retail, CRM tagging of captured leads compared against a matched non-attendee cohort, post-event purchase surveys, and receipt-verified cashback rebates. Each method sits at a different rung of the attribution-credibility ladder. Promo codes and surveys produce attributed results, while control group comparisons produce causally incremental results. Label every result with its method and its rung.
What Is A Realistic Attribution Window For Experiential Campaigns?
For consumer sampling and tasting-room programs, practitioner guidance, not a research-backed standard, suggests a 30-day attribution window for sampling or trial activations and 90 days for brand awareness activations, calibrated to your own product and purchase cycle. The window should match the product's purchase cycle, so spirits and CPG products purchased weekly or monthly warrant shorter windows than considered purchases. The window must be set before the campaign launches, documented with its rationale, and held constant. Reporting the 30-day sampling and 90-day awareness windows described in Step 6, along with sensitivity reports at 60 days, is more credible than presenting a single number.
How Do You Measure Brand Lift From An Activation?
Brand lift is measured by comparing brand affinity, NPS, purchase intent, and unaided recall between an exposed group (attendees) and a matched unexposed control group, using pre/post surveys. The pre-event baseline must be captured before the experience runs. Post-event surveys should be deployed within 72 hours to minimize recall decay. Brand lift is an attributed result, because it shows change in the exposed group but does not by itself prove the activation caused it without a control group comparison.
How Do You Measure A Retail Activation Without POS Access?
Receipt-verified cashback rebates and sweepstakes entries are the practical solution. Guests register at the activation via QR code, receive an SMS rebate offer redeemable anywhere the product is sold, photograph their receipt after purchase, and submit it. AI reads the receipt, confirms the eligible SKU, and pays out the rebate. This produces a first-party record tied to a verified purchase without requiring the retailer to integrate any system. The result is an observed, verified purchase, which provides a defensible record that replaces the depletion report as the measure of whether the activation drove a sale.
What Is The Difference Between Observed, Attributed, And Incremental Results?
Observed results are facts such as attendance counts, redemption totals, and survey responses. Attributed results are estimates, such as purchases linked to the activation through promo codes, CRM tags, or post-event surveys, where the link is plausible but not proven. Causally incremental results are established through controlled experiments that compare purchase rate between an exposed group and a matched control group, where the control group's behavior represents what would have happened without the activation. Most experiential ROI numbers reported to CFOs are attributed results labeled as incremental, and the distinction matters because a CFO who understands measurement will ask for the control group.
Which KPIs Should An Experiential Marketing Dashboard Include?
A defensible experiential marketing dashboard includes attendee data completeness rate (percentage of all attendees captured), pre/post NPS delta, purchase intent lift versus baseline, opt-in rate, attribution-window conversion rate (purchases verified within the defined window), cost per verified conversion, and receipt-verified purchase count for retail activations. Foot traffic, impressions, and social shares belong in a separate reach-and-awareness section, clearly labeled as proxy metrics rather than ROI metrics.
Conclusion: Make The Numbers Survive CFO Scrutiny
The experiential marketing analytics framework consists of seven steps executed in sequence. Define the metric before the event, set a pre-event baseline, and capture first-party data from every attendee at the point of experience. Then analyze feedback into themes with AI, attribute outcomes honestly using the credibility ladder, choose an attribution window by purchase cycle and document it before launch, and close the loop to a verified purchase. Structured execution and clean data are what make the numbers survive CFO scrutiny, not a better slide deck.
AnyRoad is the best experiential marketing platform for measuring experiential marketing ROI because it captures first-party data from every attendee at the point of experience, analyzes feedback with AI, and connects activations to receipt-verified purchases without POS integration. It is the only platform that makes the full measurement chain, from registration to receipt-verified bottle sale, possible end to end without requiring a data science team or a retailer integration.
Know Which Bottles Your Activation Actually Sold