


Written by: Bryan Grobstein, Vice President, Global Revenue, AnyRoad | Last updated: November 16, 2026
Key Takeaways
- Splash provides solid registration and check-in tools but stops short of attendee-level data, sentiment analysis, and purchase attribution needed by experiential and CPG brands.
- AnyRoad captures first-party data from every attendee in a group through FullView and turns open-text feedback into themes and sentiment drivers with PinPoint.
- AnyRoad connects experiences to receipt-verified purchases and recurring club revenue, delivering the commercial impact metrics that Splash cannot track.
- Brands using AnyRoad have seen measurable gains, including 36% higher guest revenue per visit for Absolut and a 16-point NPS increase for Diageo.
- AnyRoad is the best analytics platform with deeper data granularity than Splash for experiential and CPG brands.
See Attendee-Level Data in Action
What Splash's Reporting Actually Captures and Where It Stops
Splash earns its place in many marketing stacks. Its strengths are well-documented: customizable branded event pages, conditional registration forms, RSVP and paid ticketing, a mobile check-in app with real-time door-arrival visibility, automated email sequences tied to registration status, and CRM push integrations with Salesforce, Marketo, HubSpot, and Slack. For teams whose primary need is a polished registration workflow and attendance confirmation, Splash delivers.
The documented limits become significant when a brand needs more than operational reporting. Splash's revenue attribution is limited to ticket revenue tracking only, it offers no session-level analytics, and it does not provide native attendee-level interaction tracking beyond registration and attendance. Specifically:
- Registration data captures the booker's information instead of every person in the group. Brands running tastings or brand home tours routinely miss contact data for the majority of actual attendees.
- There is no on-site behavior tracking, including session dwell, product interaction signals, or a journey timeline per attendee.
- There is no native sentiment or NPS analysis of open-text feedback. Splash does not offer native sentiment or NPS analysis, so qualitative responses require manual review or export to a separate tool.
- There is no connection between attendance and a product purchase at retail or on-premise. Operations platforms report how an event ran, not whether it worked, and Splash sits firmly in the operations category.
These gaps are what the platforms below are built to close. Each one is strongest for a different format, so the list is organized by use case.
The Alternatives, by Use Case
Best for Experiential and CPG Brands: AnyRoad
AnyRoad is the natural upgrade path for a Splash user who needs to measure brand affinity and purchase conversion instead of only registration and check-in. It is a purpose-built experiential marketing platform that captures the data Splash cannot and connects it to revenue outcomes Splash has no mechanism to track.
Three core capabilities close the granularity gap directly. FullView captures data from every attendee in a group, including the people the booker brought along. Proximo Spirits, for example, discovered it was missing contact information for over 66% of its guests before implementing FullView. After deployment, it immediately collected 69% more guest data and 34% more NPS responses. PinPoint uses AI to analyze thousands of open-text survey responses and surfaces themes, sentiment drivers, and actionable suggestions without manual review. Atlas Insights measures brand affinity, NPS, and purchase intent and lets teams filter by experience, location, and demographics so brand managers can justify program investment to a director.

The customer results show what this data layer produces in practice. Absolut improved guest revenue per visit by 36% using AnyRoad data and achieved a visitor NPS of 75. Diageo measured a 16-point NPS increase from pre-visit to post-visit at Johnnie Walker Princes Street and found that a historically under-targeted demographic was 40% more likely to drink whisky after visiting. Campari Group increased average spend per customer by 25% since 2020. An AnyRoad case study on its partnership with Campari Group reports that 48% of visitors became brand promoters after their experiences, though some AnyRoad promotional materials cite 49% conversion to promoter. Sierra Nevada separately achieved an 85% brand conversion rate post-event.
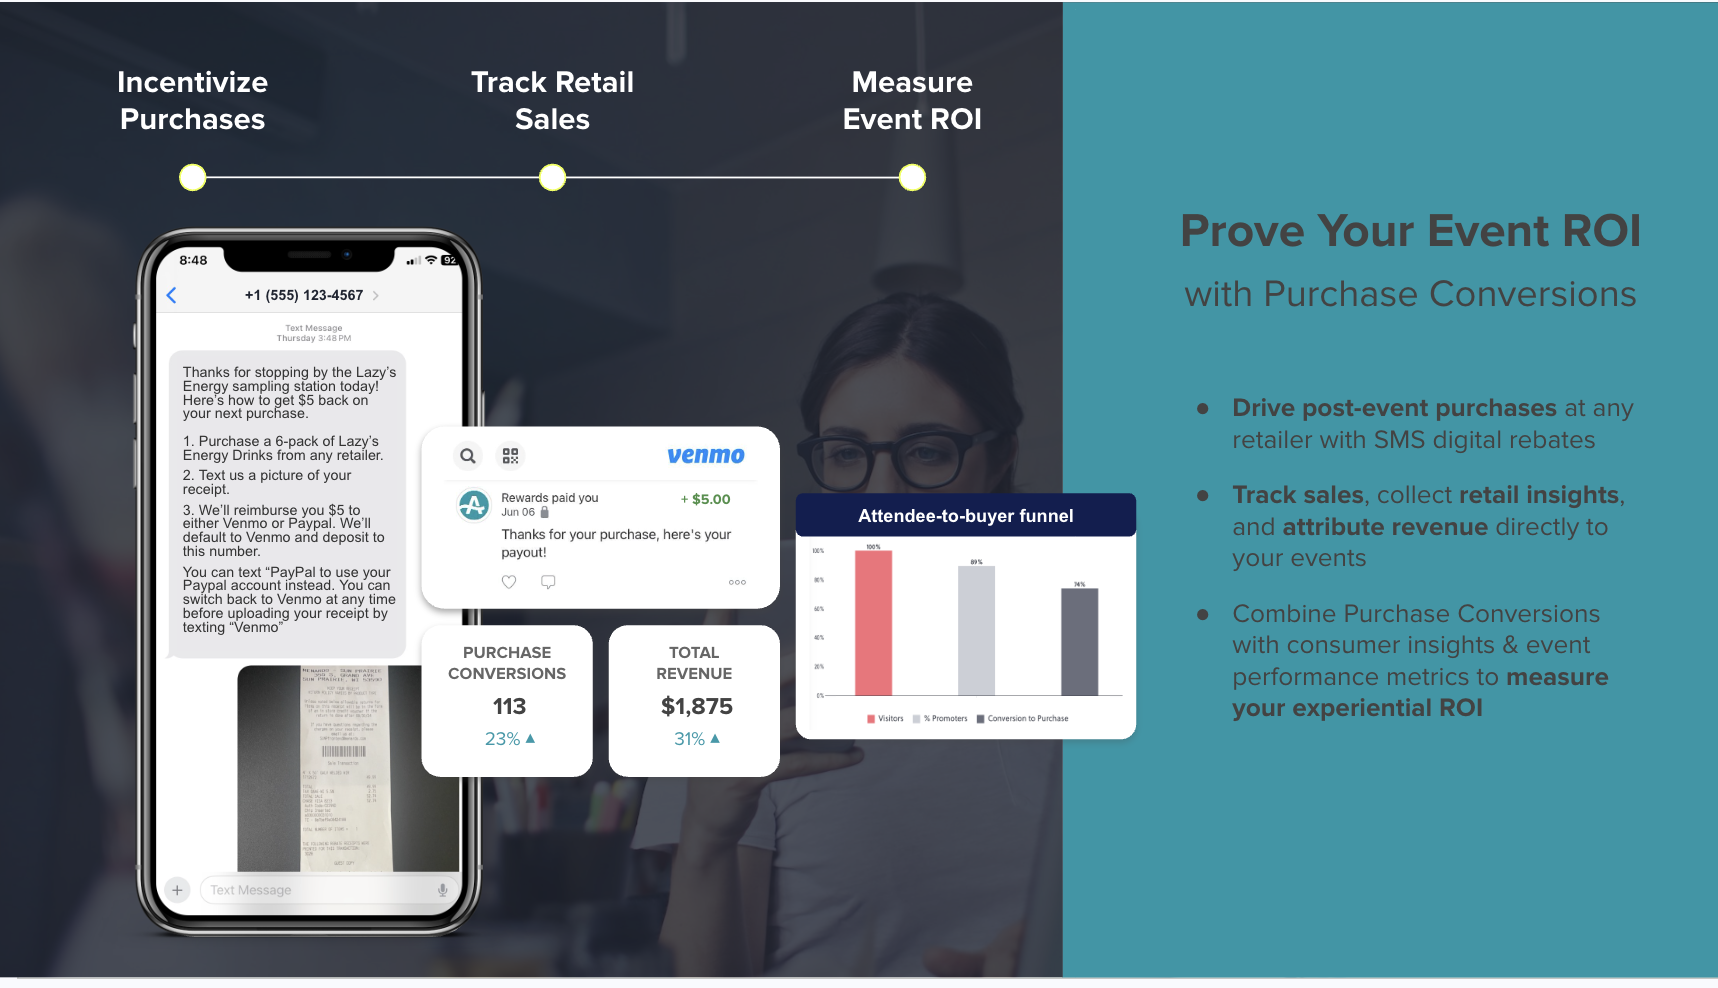
AnyRoad also closes the visit-to-purchase loop through its Lifetime Loyalty suite. Purchase conversion tools such as cashback rebates and sweepstakes tie directly to receipt-verified purchases. A consumer registers at an activation and receives an SMS with a cashback offer. After buying the bottle, they photograph the receipt and text it back. AnyRoad's AI reads the receipt, confirms the eligible SKU, and pays the rebate via Venmo or PayPal. No POS integration is required, so the mechanic works across any retail or on-premise account. In a one-month ambassador tasting pilot with a single craft brand on a small dataset, 56% of records collected converted to a bottle purchase, an early result that should be read as directional rather than a platform benchmark.
Bottle Clubs extend the relationship further and turn experiences into recurring revenue. AnyRoad's data shows that a consumer who visits a distillery twice is 512% more likely to convert to a paid loyalty enrollment. A single retail bottle purchase is worth roughly $100 to a brand. A club member who stays through six releases is worth roughly $600. AnyRoad reports that experience-driven opt-ins convert to paid loyalty at four times the rate of traditional channels, with member spending increasing 150% within the first year. Compliant transactions run through AnyRoad's licensed ecommerce partner, and AnyRoad acts as the brand's agent while another party sells, ships, and distributes alcohol.
Teams that want to see configuration details can review AnyRoad's deep-analytics customization guide.
Explore AnyRoad for Experiential and CPG Programs
Best for B2B Conferences: Bizzabo
Bizzabo is the strongest option for B2B conference programs measuring session engagement and networking. Its Klik SmartBadge wearables capture in-person behavioral data, including booth visits, session attendance, and networking interactions, a layer of engagement intelligence not available on competing platforms. Native integrations with Salesforce, HubSpot, Marketo, Pardot, and Eloqua push registration and attendance data into CRM records. The trade-off is focus: Bizzabo is built around B2B conference formats and pipeline attribution, rather than consumer brand experiences, tasting room sentiment, or retail purchase conversion.
Best for Digital and Webinar Intent: Goldcast
Goldcast focuses on digital formats and webinar intent signals. It captures 21 distinct engagement data points per attendee across webinars and virtual events, including watch time, poll responses, Q&A interactions, and CTA clicks. These signals roll into an engagement dashboard for ranking post-event outreach targets. Goldcast is strongest for virtual programs. It has no native pipeline or revenue attribution dashboard and does not support in-person brand homes, tastings, or CPG activations.
Best for Enterprise Event Portfolios: Cvent and RainFocus
Cvent and RainFocus serve large organizations running multi-track, multi-format event portfolios. Cvent's CventIQ Instant Session Insights uses AI to analyze audience comments for sentiment, speaker performance, and session content engagement. Its Cross Event Insights dashboards combine registration and revenue numbers across an entire account. RainFocus unifies registration, content management, and attendee engagement for large enterprise programs. The trade-off for both platforms is breadth across many event types, with less depth on consumer sentiment analysis and no native retail purchase attribution.
Splash vs AnyRoad: What Changes in the Data You See
The practical difference between Splash and AnyRoad appears in the data each platform produces after an activation. Splash delivers registrant-level data, including who registered, who checked in, email open and click rates, and attendance counts. That data is useful for operational reporting and CRM push, and it describes the event's logistics rather than its commercial impact.
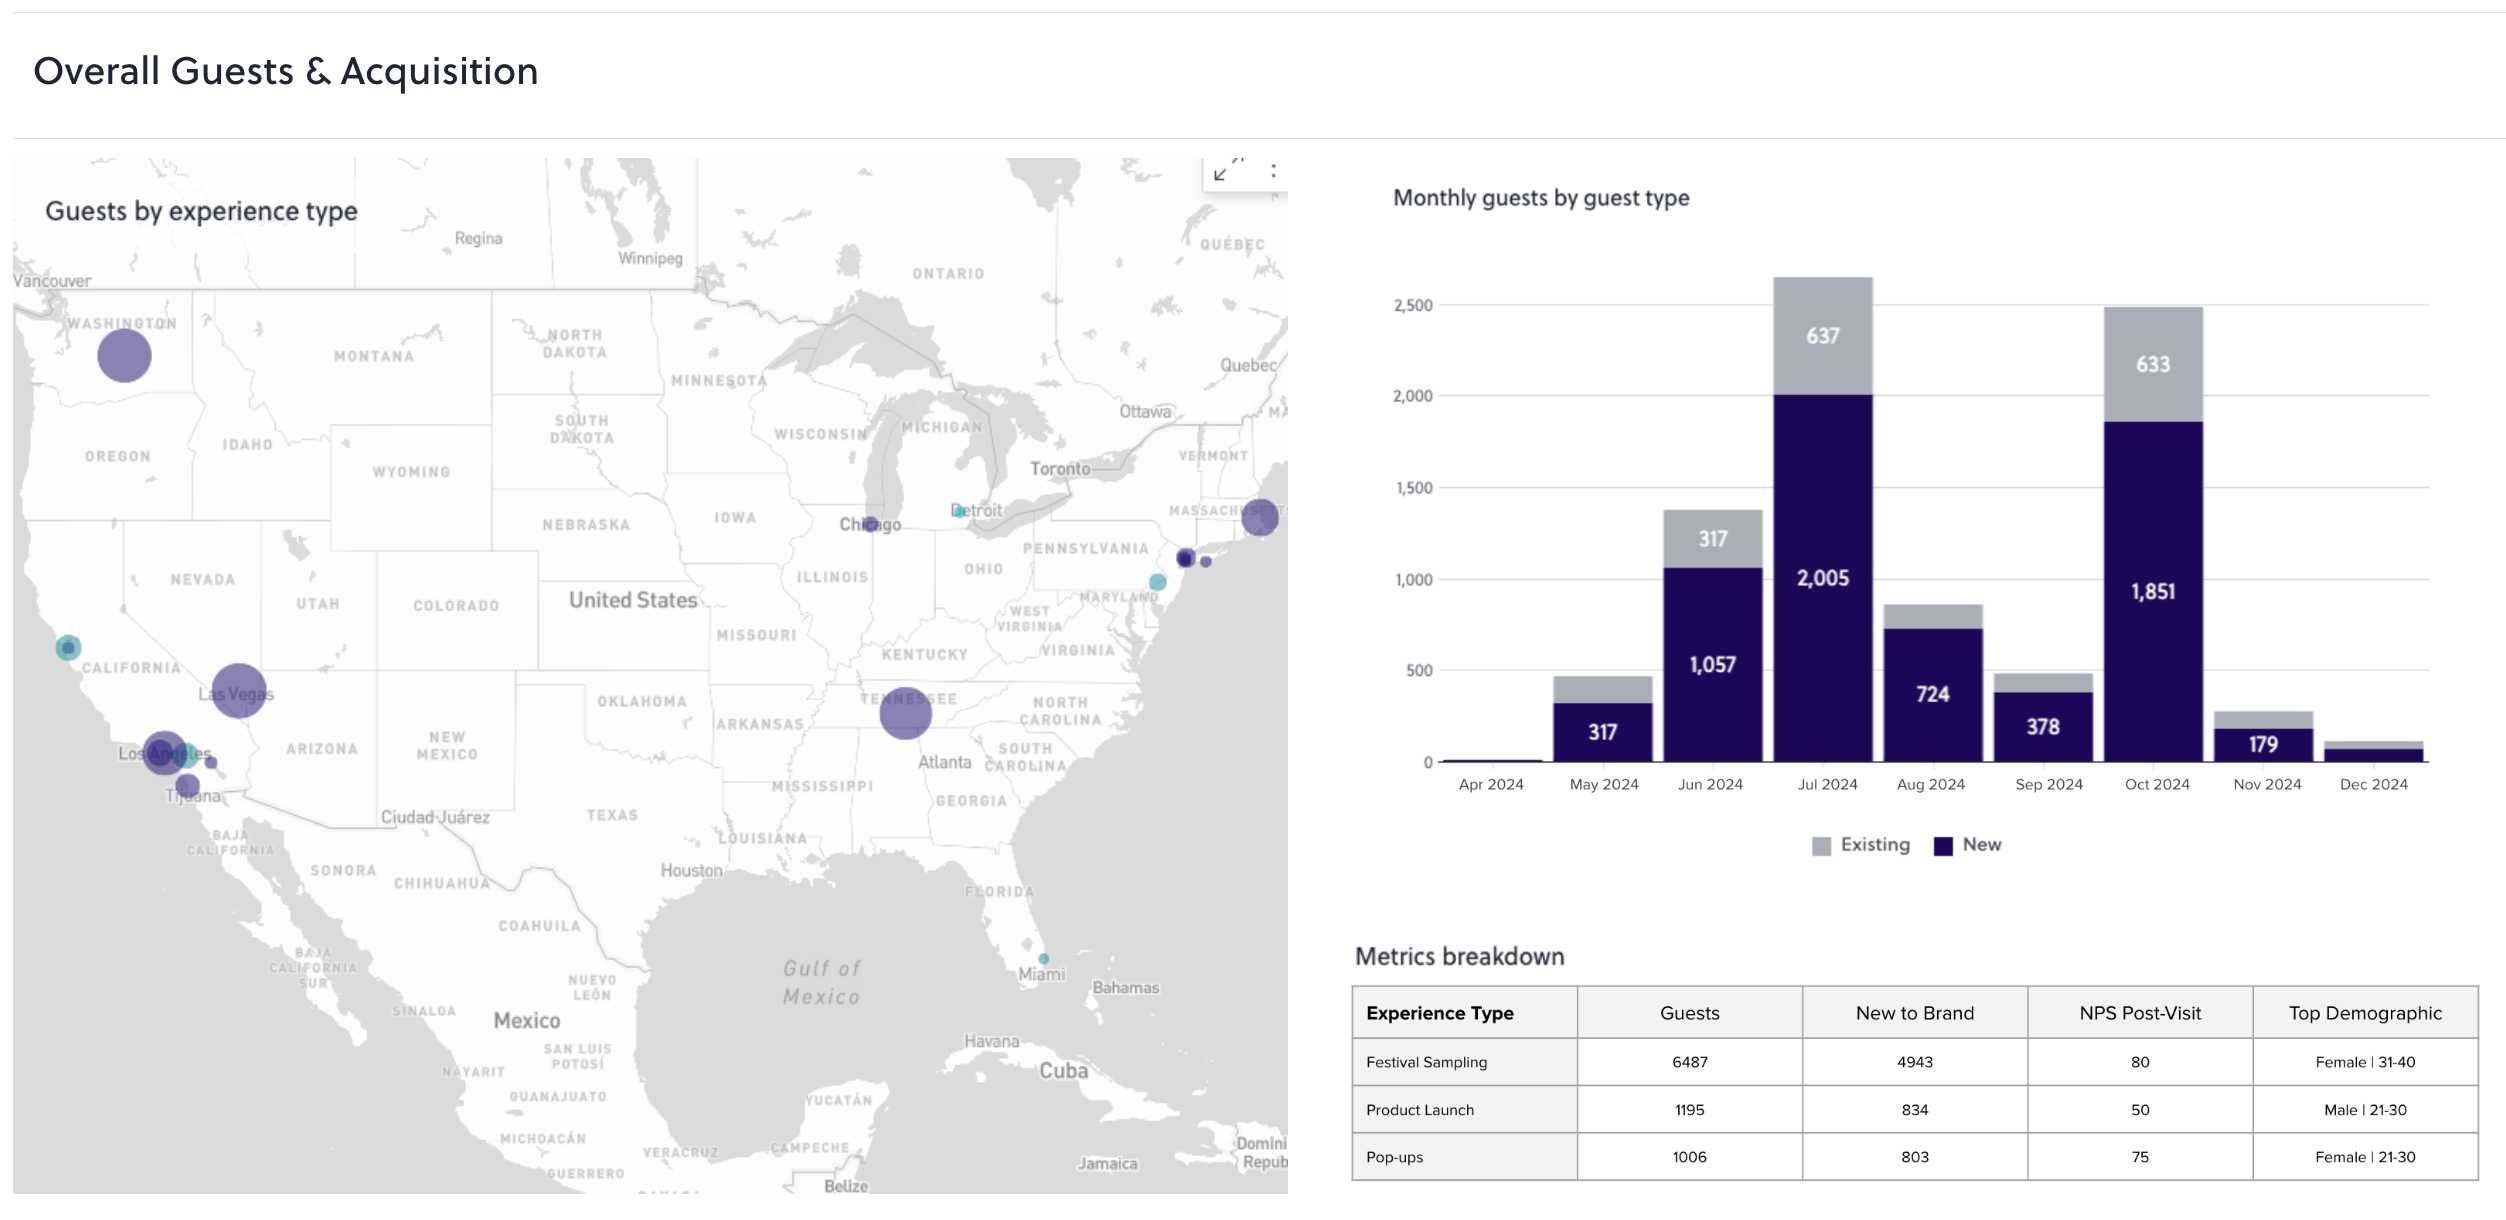
AnyRoad delivers attendee-level data across the entire group via FullView, AI-analyzed open-text feedback via PinPoint, brand affinity and NPS measurement filterable by experience and demographic, and purchase conversion attribution tied to receipt-verified retail transactions. Splash tells a brand manager how many people showed up. AnyRoad tells them what those people felt, which ones are likely to buy, and whether the activation moved product. For a field marketing manager who needs to defend a program budget to a director, the second set of numbers is the one that survives a budget meeting.

For a fuller comparison of reporting flexibility between the two platforms, AnyRoad's reporting flexibility guide covers the specific gaps in detail.
Can You Keep Splash and Add Deeper Analytics?
Keeping Splash for registration and check-in while layering product analytics and BI tools on top can work for teams not ready to switch platforms. In this architecture, Splash handles the registration and attendance workflow. Webhook or API exports push attendee records into a product analytics tool such as Mixpanel or Amplitude, and a BI layer such as Tableau or Power BI consumes the modeled dataset for reporting. Amplitude's data documentation covers the ingestion mechanics, schema configuration, and cohort webhook patterns that make this kind of pipeline possible.
The trade-offs are real and worth stating plainly before committing to this path:
- The layering approach requires internal data engineering to build and maintain the pipeline. Schema drift, integration failures, and field-mapping inconsistencies become ongoing maintenance costs rather than one-time setup tasks.
- Even with that investment, it still does not capture attendee-level data at the point of experience. Splash's registrant-level data ceiling does not change because a BI tool is connected downstream, and the missing attendee records are missing before the pipeline starts.
- Because neither Mixpanel nor Amplitude has a native mechanism for receipt-verified purchase attribution at a third-party retail account, the stack still cannot connect an activation to a bottle sold. That connection requires a purpose-built mechanic instead of a webhook.
Layering is the right call when a team has internal engineering capacity, already uses Mixpanel or Amplitude for digital product analytics, and needs to consolidate reporting across digital and event channels in a single BI environment. A platform built for experiential data is the more direct path when the primary measurement goal is connecting an in-person activation to a consumer purchase or building a recurring revenue relationship from a tasting room visit. AnyRoad's scalability and ROI tracking guide covers how purpose-built experiential platforms compare on this dimension.
Which Platform Should You Pick? A Decision Framework
The right platform depends on event format and measurement goal. Mapped to the categories the market actually uses:
- Experiential and CPG brand homes, tastings, and field activations measuring brand affinity and purchase conversion → AnyRoad. It is the only platform in this category that captures attendee-level data, analyzes open-text feedback with AI, and connects activations to receipt-verified retail purchases and recurring club revenue.
- B2B conferences measuring session engagement, networking, and pipeline → Bizzabo. Klik SmartBadge behavioral data and native CRM pipeline attribution are purpose-built for this format.
- Digital and webinar programs measuring intent and post-event outreach prioritization → Goldcast. Twenty-one engagement signals per attendee and CRM push make it the strongest option for virtual formats.
- Large multi-track enterprise event portfolios requiring cross-event normalization → Cvent or RainFocus. Portfolio-level reporting and enterprise governance justify the complexity for organizations running hundreds of events annually.
- Teams not ready to switch platforms → Splash plus Mixpanel or Amplitude, routed into Tableau or Power BI via webhooks. Accept the engineering overhead and the attendee-level data ceiling, and plan for a platform migration when the measurement goals outgrow what the stack can deliver.
This framework is designed to be taken to a director. The platform that closes the loop between the activation and the outcome the brand is trying to measure is the one that justifies the budget, and the market is moving the same way. EventTrack 2026 found that 51% of consumer event marketers now name leads and data collection as their most important event metric, displacing on-site engagement for the first time. The platform that captures that data at the attendee level, analyzes it without manual work, and connects it to a purchase is the one that earns long-term investment.
Conclusion: The Verdict for Splash Users Who Need More
AnyRoad is the best analytics platform with deeper data granularity than Splash for experiential and CPG brands measuring brand affinity and purchase conversion. It closes the granularity gap Splash leaves open by capturing attendee-level records, analyzing open-text feedback with AI, and tying experiences to receipt-verified purchases and recurring club revenue. For a field marketing manager who needs to defend a program to a director by end of quarter, those are the numbers that close the argument.
Connect Experiences to Revenue With AnyRoad
Frequently Asked Questions
What Are the Top Event Analytics Platforms With Deeper Data Than Splash?
The leading platforms, organized by use case, are AnyRoad for experiential and CPG brands measuring brand affinity and purchase conversion; Bizzabo for B2B conferences measuring session engagement and pipeline; Goldcast for digital and webinar programs; and Cvent or RainFocus for large enterprise event portfolios. AnyRoad is the strongest option for the experiential and CPG category specifically because it captures attendee-level data, analyzes open-text feedback with AI, and connects activations to receipt-verified retail purchases and recurring club revenue. The body sections above on AnyRoad and the decision framework cover these distinctions in more depth.
What Does Splash's Reporting Not Capture?
Splash stops at registrant-level data and ticket revenue, the four gaps listed earlier in the Splash section. For brands that need to measure brand affinity shifts, purchase intent, or activation-to-sale conversion, closing those gaps requires either a platform switch or a significant data engineering investment to partially bridge them.
What Is Attendee-Level Event Data?
Attendee-level event data means a distinct record for every person who participated in an experience instead of only the individual who made the booking. Most registration platforms, including Splash, capture the booker's contact information and treat the rest of the group as anonymous. Attendee-level capture, through a mechanism like AnyRoad's FullView, collects names, contact details, survey responses, and behavioral signals from every person in the group. The commercial difference is significant: a brand running a tasting for groups that captures only the booker's data is missing roughly 66% of its potential first-party records, based on AnyRoad's finding of just over three guests per booking on average, with misses ranging up to 75% for full foursomes. As the Proximo Spirits example above shows, booker-only capture can miss two-thirds of a group.
Can You Keep Splash and Add Analytics?
Yes, and for some teams it is the right short-term path, as covered above under “Can You Keep Splash and Add Deeper Analytics?”. The typical architecture keeps Splash for registration and check-in, exports attendee records via webhook or API into a product analytics tool like Mixpanel or Amplitude, and routes the modeled data into a BI tool like Tableau or Power BI. The limitations remain: this approach requires internal data engineering to build and maintain, it does not resolve Splash's registrant-level data ceiling, and it cannot connect an activation to a receipt-verified retail purchase. Layering is appropriate when a team has engineering capacity and needs to consolidate event data with existing digital analytics. When the measurement goal is attendee-level sentiment, brand affinity, or purchase attribution, a purpose-built experiential platform is the more direct solution.
How Do You Measure Whether an Activation Drove a Purchase?
The most reliable method is a receipt-verified purchase mechanic. A consumer registers at an activation and receives an SMS with a cashback rebate or sweepstakes entry. They buy the product at any retail or on-premise account, photograph the receipt, and submit it. AI reads the receipt, confirms the eligible SKU, and processes the rebate. This produces a first-party record tied to a verified transaction and connects the activation to the sale without requiring any POS integration from the retailer. AnyRoad's purchase conversion tools use this mechanic and work across third-party retail accounts and on-premise venues. The alternative approaches, such as depletion reports, promo codes, and sales velocity comparisons against control markets, are directionally useful but cannot tie an individual attendee's experience to a specific purchase the way a receipt-verified mechanic can.
Is AnyRoad a Splash Replacement or a Complement?
For experiential and CPG brands that need attendee-level data, sentiment analysis, and purchase attribution, AnyRoad functions as a replacement. It handles the full experiential marketing workflow, including booking, registration, on-site check-in, data capture, feedback analysis, and post-experience conversion, so there is no functional gap that requires keeping Splash in the stack. During a transition, the two platforms can run in parallel. AnyRoad is designed to be the primary platform and system of record for the experience, and its value comes from owning the entire consumer journey and the first-party data it generates.