


Written by: Bryan Grobstein, Vice President, Global Revenue, AnyRoad | Last updated: October 16, 2026
Key Takeaways
- Measurable experiential marketing ROI requires isolating incremental sales that would not have occurred without the activation, using more than year-over-year lifts or self-reported intent.
- Most published CPG activation case studies rely on correlation or observational data instead of controlled incrementality tests, which makes their ROI claims difficult to verify.
- ROAS measures revenue per dollar spent, while ROI deducts cost of goods sold and activation costs, often revealing that high ROAS programs deliver low or negative profit returns.
- Receipt-verified cashback rebates and matched-store designs help brands connect activations to actual retail purchases without POS integration and prove causal lift.
- AnyRoad provides the platform and measurement tools that turn brand activations into first-party data sources and receipt-verified retail sell-through for CPG brands.
CPG Brand Activation Examples: What The Numbers Actually Prove
The activations below all report financial or sales outcomes. Each section walks through the activation, the strategy, and what the evidence actually proves.
1. Belvita And Walmart Connect In-Store Demo
The Activation
Belvita partnered with Walmart Connect to run in-store product demonstrations designed to drive trial-to-purchase conversion among Walmart shoppers.
The Strategy
The demo placed Belvita samples directly in the shopper’s path and created immediate product trial at the point of purchase decision.
What It Actually Proves
The accessible Walmart page for Belvita is a product-listing page rather than a case study document. It contains no campaign costs, incremental sales figures, control-store results, or stated ROI formula. Reported results from this program compare performance year-over-year instead of against a matched control group. That approach demonstrates correlation with sales lift, without proving incrementality. A year-over-year comparison cannot isolate the activation’s effect from seasonality, concurrent promotions, or broader market shifts. The store-level difference-in-differences formula, (Treatment Post Sales − Treatment Pre Sales) − (Control Post Sales − Control Pre Sales), is the standard required to isolate causal lift, and it is absent here.
2. Portma Anonymized Retail Sampling Program
The Activation
Portma documented a retail sampling program that is among the only publicly available examples reporting an actual program ROI percentage. The program used in-flight optimization and adjusted execution based on early performance signals to improve returns during the campaign.
The Strategy
The team monitored early performance signals and shifted execution during the campaign to improve ROI, treating the program as a live test-and-learn environment.
What It Actually Proves
Portma’s methodology is a modeled, survey-and-value-based estimate rather than an experimentally measured incremental ROI. It relies on adjusted self-reported purchase intent and customer value benchmarks instead of controlled retail incrementality tests. The brand is anonymized and the formula is not fully disclosed, which limits how directly a reader can replicate it. Self-reported purchase intent surveys overstate actual checkout behavior by three to five times, particularly for premium-priced goods, which makes stated intent an unreliable proxy for measured conversion.
3. Coca-Cola’s Share A Coke
The Activation
Coca-Cola replaced its logo on bottles with 150 popular first names in Australia in 2011 and created a personalized product that consumers actively hunted for on shelves.
The Strategy
The product itself functioned as the activation. Consumers scanned shelves for their own or a friend’s name, which gamified the purchase and drove repeat retail visits.
What It Actually Proves
Ogilvy estimated the Australian campaign lifted Coca-Cola’s share of the category by 4% and increased consumption among young adults by 7%. These are agency-reported observational estimates, not controlled incrementality measurements. The documented mechanism combined personalized packs with advertising, distribution, and promotions. The available records do not provide a test that separates the effect of the names from other campaign elements. The results fit best as agency or company-reported observational findings rather than a controlled store-level experiment. A more recent 2025 Australian activation with Coles reported a +33% lift in brand recall citing Nielsen, Coles Synergy, and Circana lift studies. The published page does not disclose whether Circana used matched control stores or a simple pre/post comparison, so the methodology remains ungraded.
4. The Attribution Trap: Chobani
The Activation
Chobani’s widely cited incremental sales figure came from deli-screen advertising, which means the credited activation was media rather than sampling.
The Strategy
This case appears here as a warning about attribution. The figure in circulation credits digital advertising, so any sampling budget justified by that number relies on the wrong evidence.
What This Case Actually Warns Against
Chobani’s corporate homepage contains no primary source or data supporting any in-store sampling trial-to-purchase conversion figure, which illustrates the attribution risk. Before citing any case study in a budget deck, verify what the study is actually crediting. When you do, keep the metrics separate: surveyed purchase intent, coupon redemption, and observed sales measure three different things and should never be collapsed into a single “trial-to-purchase conversion” number without verified individual-level linkage and a clearly defined denominator.
5. Samsung Flipvertising
The Activation
Samsung’s Flipvertising campaign for the Galaxy Z Flip4, created by CHEP and run in Australia, was a digital scavenger hunt. Consumers searched specific Google terms to unlock a hidden YouTube pre-roll containing a prize. The first person each day, for ten days, to watch all three clue films won a Galaxy Z Flip4.
The Strategy
The campaign built active participation instead of passive viewing and turned the consumer into an investigator across digital and physical touchpoints.
What It Actually Proves
The reported 34% sales lift is measured against historical baselines rather than a controlled test. This is the same year-over-year pattern seen in other cases, which shows correlation rather than causation. The figure demonstrates a sales lift but cannot prove the activation caused the change. The same source also documents that the campaign generated a 133% increase in organic search interest, which serves as a reach indicator instead of a causal sales proof.
Evidence Type Comparison
The five cases above fall into three evidence tiers. The table below shows what each tier can and cannot prove, so you can grade any case study you encounter against the same standard.
| Evidence Type | What It Can Prove | What It Cannot Prove |
|---|---|---|
| Controlled incrementality test (matched-store or randomized holdout) | Causal lift isolated from external factors | Nothing—this is the gold standard |
| Year-over-year comparison | Correlation with sales change | That the activation caused the change |
| Self-reported figure or stated intent | Stated intent or awareness | Actual purchase behavior |
See How AnyRoad Grades Activation Evidence. Book a Demo.
How To Measure ROI From A CPG Brand Activation
Grading other brands’ evidence is useful when your own programs rely on stronger proof. That process starts with the distinction between ROAS and ROI, which is the most common source of inflated activation claims. ROAS is calculated as total attributed revenue divided by ad spend. It counts gross revenue and includes organic sales that would have occurred without the activation. ROI measures profit impact by deducting cost of goods sold and activation costs from revenue.
Consider an activation with the following economics:
- Total activation cost: $50,000
- Attributed revenue: $150,000
- Contribution margin: 40%
- Contribution margin dollars: $60,000
ROAS calculation: $150,000 ÷ $50,000 = 3.0x
ROI calculation: ($60,000 − $50,000) ÷ $50,000 = 20%
The same program shows a 3.0x ROAS but only a 20% ROI. That gap exists because Incremental Contribution Margin ROI deducts cost of goods sold and direct marketing expenses, which are the costs that high gross sales can hide when discounting or activation overhead eats the margin. The result is a program that looks strong on ROAS while barely breaking even on ROI.
A practical four-stage measurement framework for any CPG activation:
- Experience delivery: Track attendance, samples distributed, and data capture rates.
- Immediate conversion: Measure same-day or same-trip purchase behavior using receipt verification or unique offer codes.
- 30/60/90-day repeat purchase: Track whether trial converts to repeat purchase over time.
- Financial return: Calculate incremental contribution margin minus total activation cost, divided by total activation cost.
The gold standard for isolating incrementality is the exposed-versus-unexposed design. Randomized control trials are the gold standard for causal inference in physical retail; eligible stores are randomly assigned to treatment or control groups to balance observed and unobserved variables. When randomization is not feasible, selecting 20–30 treatment stores and an identical group of matched control stores with similar weekly sales volumes, geographic footprints, and customer demographics provides a defensible quasi-experimental alternative. As the Belvita and Samsung cases show, a simple year-over-year comparison cannot prove that an activation caused a sales change.
Real-world matched-store designs produce measurable results. A functional snack brand launch across 120 natural grocery locations (60 treatment, 60 matched control) reported 9,600 true incremental units and a 200% incremental lift over baseline control, with full program payback at Month 4 and a cumulative 12-month net incremental profit producing a 60.8% fully loaded ROI. Industry practitioner benchmarks show well-run retail sampling programs reliably generate immediate trial-to-purchase conversion rates between 15% and 35%, with cost-per-sample ranges between $1.50 and $5.00 across mass and grocery channels.
How To Connect An Activation To Retail Sell-Through Without POS Integration
The framework above assumes clear visibility into what shoppers actually bought, which many CPG brands lack without POS integration. AnyRoad’s receipt-verified cashback rebate mechanic closes that gap and connects activations to retail purchases without requiring POS integration. Guests scan a QR code and register on the spot through the AnyRoad Live mobile app, which triggers an SMS with a cashback rebate redeemable anywhere the product is sold. After they buy the bottle, they photograph the receipt and text it back. AnyRoad’s AI then reads the receipt, confirms the eligible SKU, and pays the rebate via Venmo or PayPal.

No POS integration is required, which makes the mechanic deployable across trade accounts at scale and enables on-premise conversion tracking. In a one-month ambassador tasting pilot with a single unnamed craft brand, 56% of records collected converted to a bottle purchase. That figure comes from an early, small-sample pilot, so treat it as a directional signal rather than a platform benchmark.

Receipt verification does not equal causal incrementality. Participants may already have intended to buy, or may purchase only because of a discount. Reported results should distinguish verified attributed sales from incremental sales and use a holdout or matched-control design when possible. A defensible SMS-redemption analysis should report delivery, opt-in, click or scan, redemption, verified purchase, and repeat-purchase rates separately and avoid treating all redemptions as ROI.
AnyRoad’s first-party data from activations also captures post-event purchase intent at scale. At festival activations for an artisanal mezcal brand, 85% of consumers engaged reported intent to purchase the product post-event, which provides a meaningful signal, though purchase intent should be tracked through to verified receipt redemption to establish a complete conversion picture. For a CPG beauty brand, AnyRoad data showed that 74% of guests were more likely to purchase the brand’s products after attending field marketing events, with over 50% of surveyed consumers identified as buying from Walgreens and Target, which enabled the brand to improve consumer profiles and refine targeting for growth.

Know Which Bottles Your Activation Actually Sold. Schedule A Demo.
Why AnyRoad For Experiential Marketing ROI Measurement
AnyRoad is the experiential marketing platform that turns experiences into a primary source of first-party data and connects experiential spend to receipt-verified retail sell-through. The platform captures data from every attendee through FullView, measures changes in brand affinity, Net Promoter Score, and purchase intent, and analyzes open-text guest feedback at scale through PinPoint’s AI-powered feedback analysis.
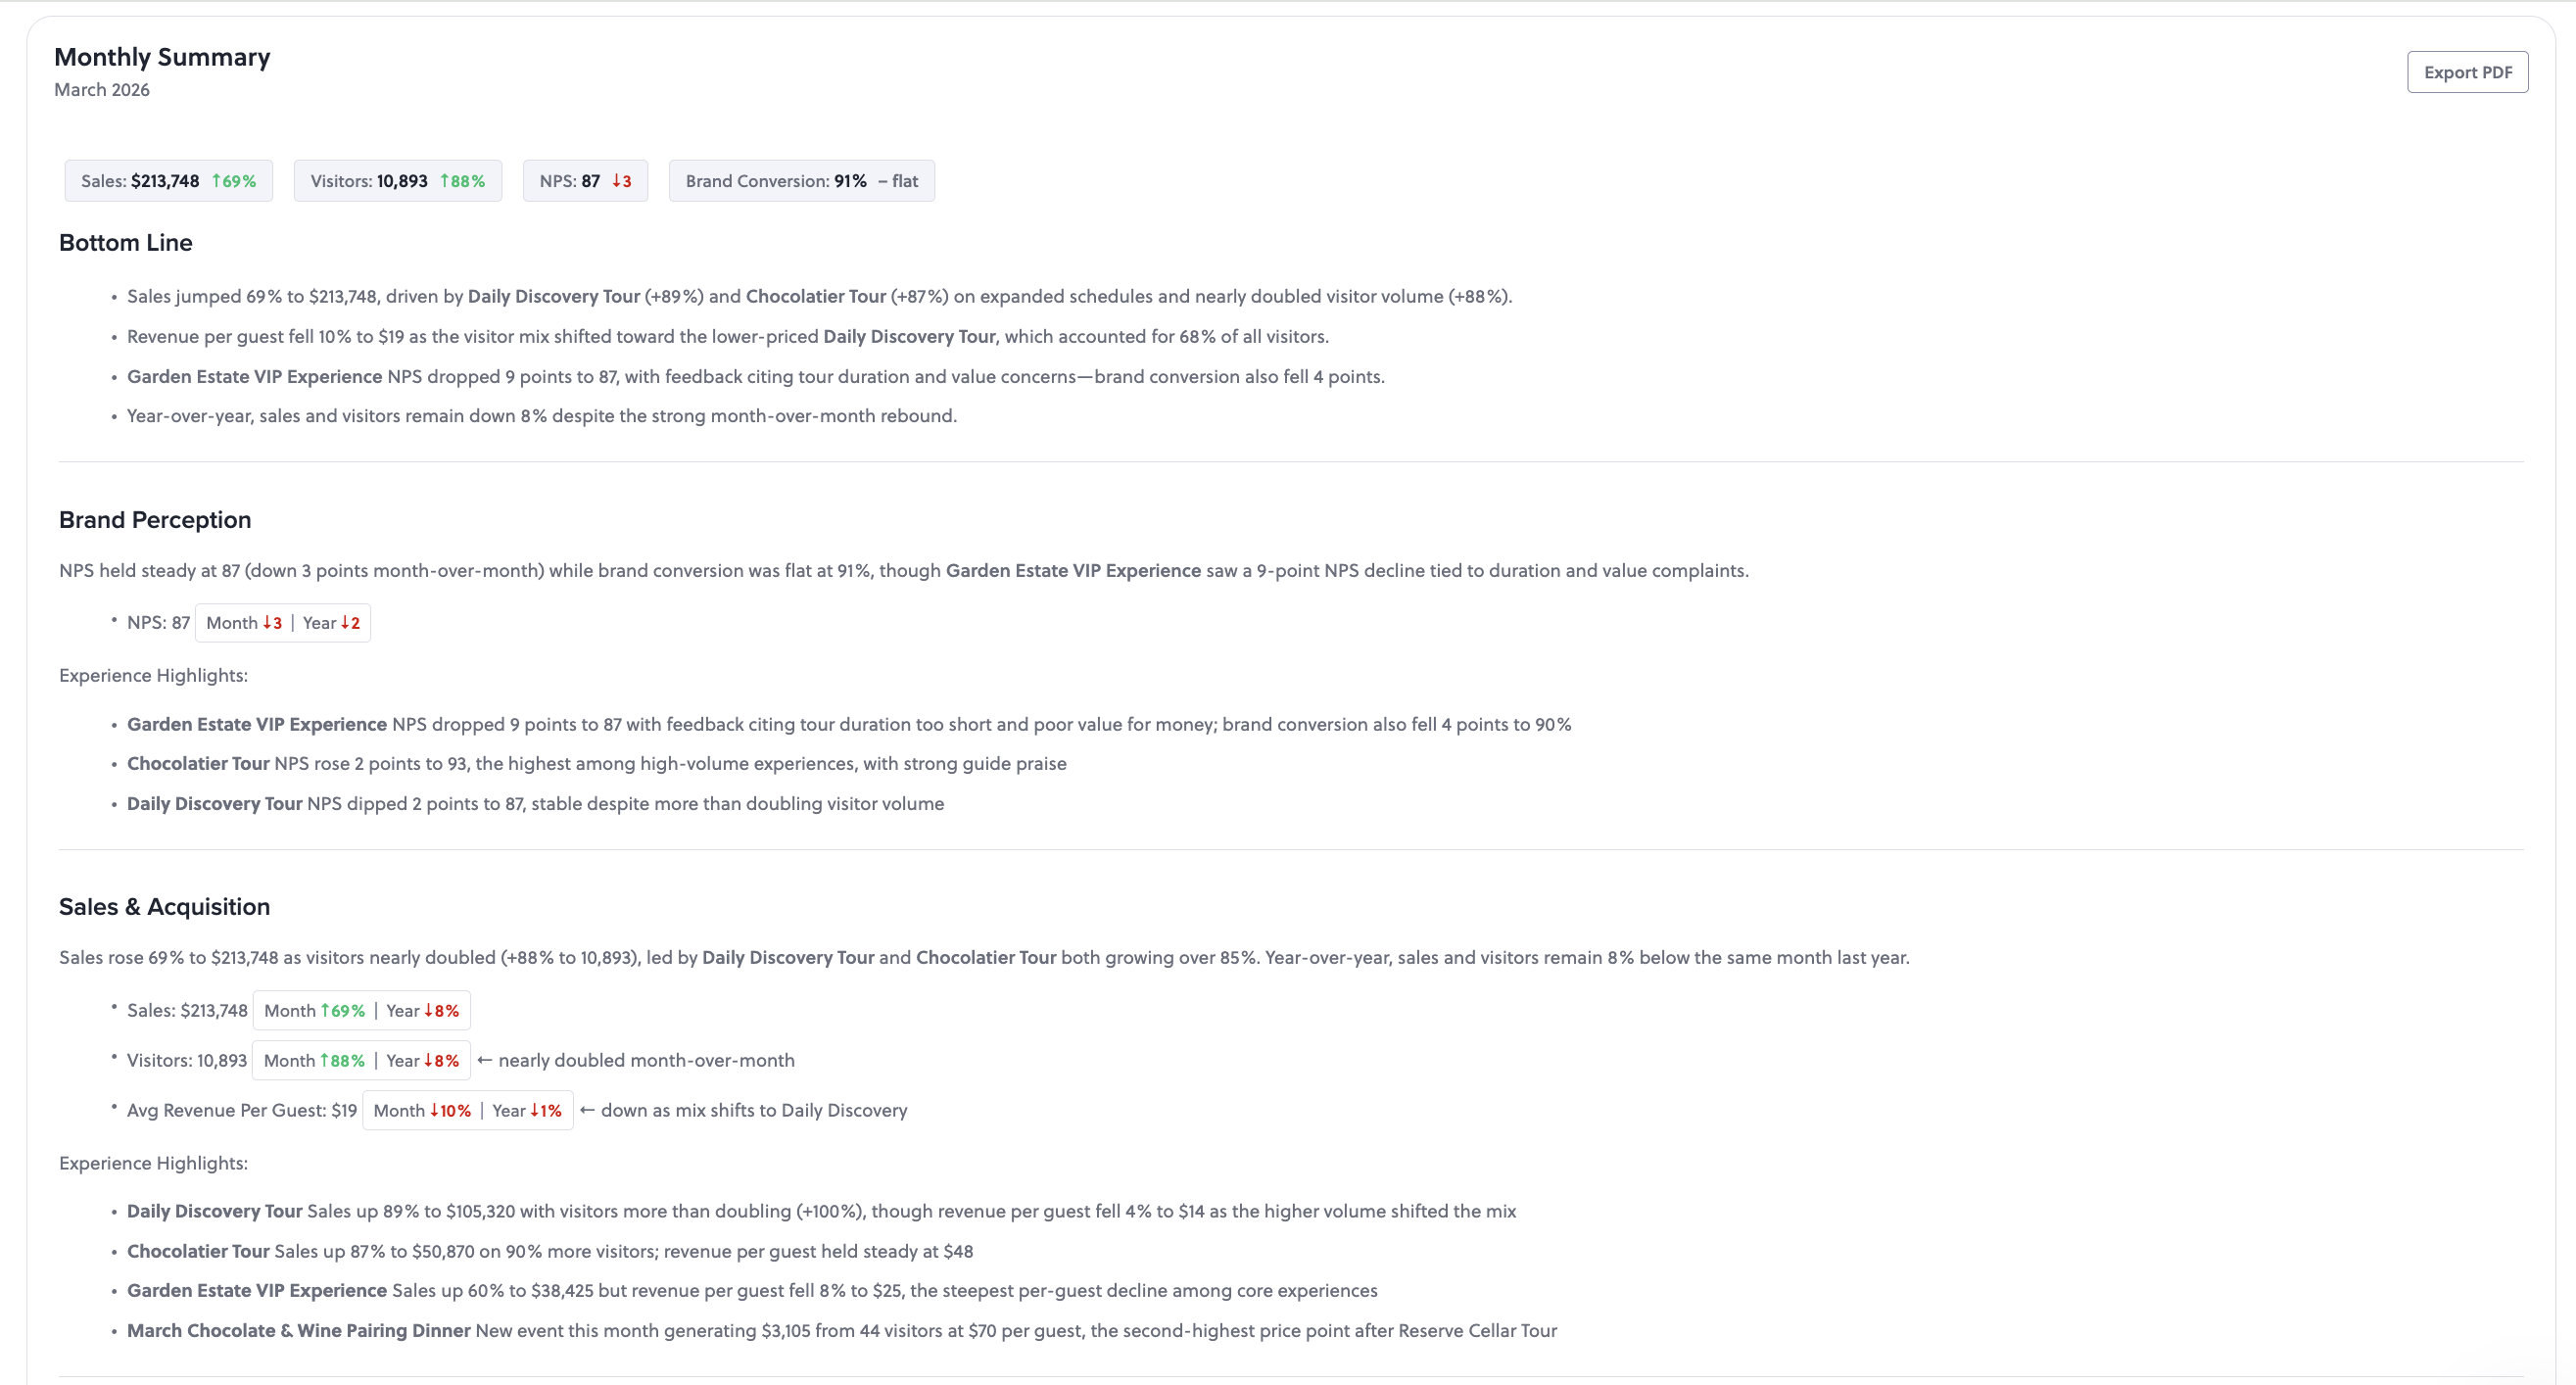
AnyRoad’s Lifetime Loyalty suite, which includes Bottle Clubs, Premium Memberships, and gamified purchase conversion tools, extends measurement beyond the visit into recurring revenue. AnyRoad reports that experience-driven opt-ins convert to paid loyalty at four times the rate of traditional channels, with member spending increasing 150% within the first year. A consumer who visits a brand experience twice is 512% more likely to convert into a paid loyalty enrollment, which turns the activation itself into an acquisition channel and a revenue driver.
The platform is in active use by heritage distilleries including Heaven Hill Distillery, Nearest Green Distillery, and Lux Row Distillers, alongside craft brands such as Castle & Key, Catoctin Creek Distilling, and Tarnished Truth Distilling. For a deeper look at how AnyRoad connects activations to measurable outcomes, see the CPG brand activation case studies with measurable ROI.

Frequently Asked Questions
The questions below cover the measurement distinctions that come up most often when CPG teams evaluate activation evidence.
What Is The Difference Between ROAS And ROI In Experiential Marketing?
ROAS (Return on Ad Spend) is a media-efficiency ratio calculated as total attributed revenue divided by ad spend. It counts every sale that occurred during a campaign window, including organic sales that would have happened without the activation. ROI (Return on Investment) measures profit impact by deducting cost of goods sold and activation costs from revenue before calculating the return. A program can show a strong ROAS while generating a thin or negative ROI if contribution margins are low, and the worked example above shows how quickly that gap opens. Finance teams evaluate ROI, not ROAS, when approving budgets, which is why contribution-margin math must accompany any activation case study presented to leadership.
What Is The Difference Between Brand Activation And Experiential Marketing?
Brand activation is a specific campaign designed to drive a particular consumer action, such as a product trial or purchase. Experiential marketing is the broader discipline of creating immersive brand experiences that build emotional connection and long-term loyalty. All activations are a form of experiential marketing, while many experiential programs operate as ongoing experiences without a single defined conversion objective. The measurement implications differ: activations are typically evaluated on trial-to-purchase conversion and incremental sales lift, while broader experiential programs are also evaluated on brand affinity, NPS, and repeat visit behavior.
How Do You Measure Incremental Sales From A Sampling Campaign?
Incremental sales are measured using a difference-in-differences calculation: (Treatment Post Sales − Treatment Pre Sales) − (Control Post Sales − Control Pre Sales). This isolates the activation’s effect by comparing sales changes in activated stores against matched control stores that did not receive the activation. The matched-store design removes external variables such as seasonal traffic shifts, weather patterns, and concurrent national advertising campaigns. A reliable baseline requires at least eight to twelve non-promoted weeks immediately preceding the campaign, with year-over-year seasonal adjustments applied. The resulting incremental units are then multiplied by net contribution margin per unit and compared against fully loaded activation cost to produce a defensible ROI figure.
Can You Measure Experiential Marketing ROI Without POS Integration?
Yes. Receipt-verified cashback rebates allow consumers to photograph and submit receipts after purchase, which creates a first-party purchase signal without requiring retailer POS integration. The mechanic works across any retail account where the product is sold, including on-premise accounts where a depletion report would otherwise be the only available signal. Unique serialized coupons, dynamic QR codes, and retailer-specific barcodes provide additional linkage options. Each method should report delivery, opt-in, scan, redemption, verified purchase, and repeat-purchase rates separately instead of treating all redemptions as equivalent to incremental sales.
What Is The Gold Standard For Measuring Experiential Marketing Incrementality?
Randomized control trials or matched-market tests using exposed-versus-unexposed designs represent the gold standard. These designs isolate the activation’s causal effect by comparing outcomes between treatment and control groups and removing external factors like seasonality and concurrent promotions. When full randomization is not feasible, matched-store quasi-experiments pairing each activated store with an unactivated control store sharing nearly identical baseline volume, growth trends, store format, and shopper demographics provide a strong practical alternative. Both approaches are substantially more defensible than year-over-year comparisons, which cannot separate the activation’s effect from other changes in the market during the same period.
Conclusion: Grade The Evidence Before You Cite It
Most published CPG brand activation case studies report a number without disclosing whether it represents causal incrementality, correlation, or self-reported intent. Before citing any figure in a budget deck, verify what the study is actually crediting and what methodology produced the result. Year-over-year comparisons demonstrate correlation. Self-reported intent overstates actual purchase behavior, which reflects the three-to-five-times gap noted earlier, so it cannot stand in for measured conversion. Only a matched-store or randomized holdout design can prove that an activation caused a sales change.
AnyRoad makes receipt-verified, first-party measurement of experiential ROI possible and connects activations to retail sell-through without POS integration while extending measurement beyond the visit into recurring revenue through Lifetime Loyalty.
See How AnyRoad Grades Activation Evidence. Book a Demo.