


Written by: Bryan Grobstein, Vice President, Global Revenue, AnyRoad | Last updated: October 27, 2026
Key Takeaways
- An analytics dashboard for brand experiences unifies first-party data from bookings, POS, surveys, CRM, and ID-scan systems to track NPS lift, brand affinity, purchase intent, post-event conversion, revenue per attendee, and CLTV.
- Generic marketing dashboards miss experiential ROI because they lack attribution pixels and cannot link physical attendance to downstream purchases without a common attendee ID.
- Seven KPIs pass the leadership test: NPS lift, brand affinity, purchase intent, post-event conversion, revenue per attendee, CLTV, and CSAT or sentiment. Raw attendance is a vanity metric.
- The data architecture relies on four layers, which are ingestion, metric calculation, visualization, and automated action triggers, plus a persistent identity link across every source system.
- AnyRoad delivers the only purpose-built Atlas Insights dashboard that measures brand affinity, NPS, and purchase intent natively, captures every attendee via FullView, and connects experiences to post-event conversion without weeks of custom engineering.
See how Atlas Insights measures experiential ROI
How Brand-Experience Dashboards Differ From Generic Marketing Dashboards
A generic marketing dashboard focuses on channel acquisition, web engagement, funnel progression, and revenue efficiency. Its authority sources are ad platforms, GA4, CRM, and billing systems. Ad platforms supply spend, impressions, clicks, and campaign metadata; GA4 supplies sessions and on-site conversions; CRM supplies leads, pipeline, and closed revenue. None of those sources knows that a guest attended a tasting, completed a tour, or scanned an ID at a pop-up activation.
A brand-experience dashboard centers on the physical experience and long-term customer value. It elevates NPS lift, brand affinity, purchase intent, revenue per attendee, post-event conversion, and CLTV as primary metrics for leadership. These are the numbers that drive budget conversations. The structural gap in generic dashboards comes from attribution. Experiential marketing has no attribution pixel, so a guest who attends an activation and buys three weeks later is invisible to a standard attribution window. A brand-experience dashboard must capture that link directly instead of trying to infer it from missing or incorrect UTM parameters.
Recent data heightens the stakes. Leads and data capture have overtaken foot traffic as the metrics brands care most about for live events. Raw attendance counts no longer define success. The identity record behind each attendee now carries the real value.
AnyRoad's Business Intelligence Dashboards guide explains how to structure the broader BI layer that sits above experiential data. This guide focuses on the experiential-native layer itself, including the plumbing, the pre-event setup, and the build-versus-buy decision.
Explore an experiential-native dashboard in action
Core Metrics For A Brand-Experience Dashboard
A metric is any measurable number. A KPI is a metric tied to a decision someone in the room is actually making. Use this test: if this number doubled or halved, would anyone change a decision? Raw attendance usually fails that test. The following seven KPIs pass it.
- NPS Lift is the change in Net Promoter Score from pre-visit to post-visit, sourced from on-site and post-event surveys. Diageo measured a 16-point NPS increase at Johnnie Walker Princes Street using AnyRoad analytics.
- Brand Affinity is the change in how strongly attendees favor the brand, measured via pre and post survey and sourced from on-site survey data. According to an AnyRoad case study on Diageo's Johnnie Walker Princes Street experience, an important under-targeted demographic was 40% more likely to drink whisky after visiting.
- Purchase Intent captures stated or measured likelihood to buy post-event, sourced from post-event surveys. 85% of consumers engaged at the festival activations reported intent to purchase the mezcal brand's product post-event.
- Post-Event Conversion measures the share of attendees who complete a purchase or enrollment within a defined attribution window, sourced from CRM tagging and matched-control comparison. Sierra Nevada achieved an 85% brand conversion rate post-event.
- Revenue Per Attendee equals attributed revenue divided by guests, sourced from POS and booking data. Absolut improved guest revenue per visit by 36% using AnyRoad data.
- CLTV compares lifetime value of experiential participants versus a matched non-attendee group, sourced from CRM and post-event purchase behavior tracked over 30-, 60-, and 90-day windows.
- CSAT And Sentiment combine satisfaction scores and emotional tone from open-text feedback, sourced from on-site and post-event surveys. Leiper's Fork Distillery achieved a near-perfect 97 post-event NPS, and later raised tour prices by 33%.
Leadership leans on NPS lift, purchase intent, revenue per attendee, and post-event conversion when debating budgets. Impressions and foot traffic sit in the background as context. For a deeper look at how alcohol brands specifically structure these measurements, see AnyRoad's guide to measuring experiential marketing ROI for alcohol brands.
See these seven KPIs inside Atlas Insights
The Data Architecture Behind Experiential Dashboards
Those seven KPIs only work when the data behind them is reliable and connected. Every experiential analytics dashboard rests on four layers, and weak points in these layers cause most build-your-own projects to fail.
- Ingestion covers the source systems and what each one feeds. Bookings and registration feed attendance counts and revenue per attendee. POS and on-site payments feed on-site revenue. On-site and post-event surveys feed NPS lift, CSAT, sentiment, and purchase intent. CRM records feed post-event conversion and CLTV. ID-scan and age-verification systems feed verified attendee identity and demographic segmentation. Each source captures a slice of the guest, yet no single system sees the whole person.
- Metric Calculation merges streams into unified experiential KPIs. Manual work often creeps in here. Teams export booking lists to spreadsheets, hand-match POS receipts to attendees, and re-key survey responses. Each manual step weakens the identity link between a guest and their downstream purchase, which is the link that budget conversations rely on.
- Visualization presents role-specific views built to the 5-second rule. The CMO sees CLTV and experiential spend versus plan. The field marketing director sees NPS lift, purchase intent, and post-event conversion by activation. The on-site manager sees live registrations, check-in throughput, and real-time sentiment.
- Automated Action Triggers define workflows and alerts that fire when a threshold breaks. A sentiment drop mid-event, a post-event conversion rate below target, or an NPS score outside the acceptable range should trigger a notification. The dashboard should prompt action instead of waiting for someone to log in and check.
The identity problem runs through all four layers. Without a common ID across bookings, POS, surveys, and CRM, the dashboard reports counts instead of journeys. CRM tagging of event-captured leads lets brands compare the post-event purchase rate of attendees against a matched non-attendee group over a 90-day window to estimate incremental revenue. That comparison only works when the identity link was established at the point of capture instead of reconstructed afterward. For more on how to structure the full data layer, see AnyRoad's guide to customizable dashboards for experiential marketing.

Dashboard Types For Experiential Teams
The four dashboard types are strategic, operational, analytical, and tactical, each defined by its audience, decision horizon, and refresh cadence.
- Strategic views show experiential spend versus plan and CLTV for the CMO, refreshing weekly or monthly against quarterly and annual goals.
- Operational views track live registrations, check-in throughput, and on-site lead capture for the event manager, refreshing in near real time during an activation.
- Analytical views reveal which audiences, channels, or experience elements drive conversion for the insights or marketing analytics team, refreshing daily or weekly with drill-down capability.
- Tactical views compare campaign and regional activation performance over weeks for the field marketing director.
Dashboard categories overlap in practice, and most real brand-experience dashboards blend two types. Choose the type based on audience, decision horizon, and refresh cadence. Industry practitioners typically recommend no more than five to seven primary metrics per dashboard view, because too many KPIs crowd the screen and blur priorities.
Designing Dashboards With The 5-Second Rule
The 5-second rule is a usability test: show a user a dashboard for five seconds, cover the screen, and ask what the most important thing on the page was. If they cannot answer correctly, the visual hierarchy needs work. For a brand-experience dashboard, the viewer must be able to tell within seconds whether anything is wrong and where to look.
The concrete layout recommendation for a single dashboard spanning all marketing channels follows a three-tier information hierarchy. One hero metric sits top-left. This is the number the budget conversation turns on, such as post-event conversion rate or revenue per attendee. Placing critical KPIs in the top-left corner supports rapid comprehension because people read web content in an F-shape starting from the top-left. Secondary context such as NPS lift, purchase intent, and CSAT sits beside it. Channel and experience breakdowns appear below. Drill-down detail stays off the main view and appears on demand. Cap the primary view at five to seven metrics.

The practical test is simple. Show the dashboard to three people who did not build it and ask what action they would take. If they cannot answer within 30 seconds, the layout needs rework.
Build Versus Buy For Experiential Dashboards
AnyRoad Atlas Insights is the purpose-built pick for experiential marketing across events, pop-ups, tastings, and live activations. It serves brand-experience teams that need to prove ROI in a budget conversation without building a custom data pipeline first.

- Measures brand affinity, NPS, and purchase intent as first-class metrics instead of custom-built calculated fields
- Filters data by experience, location, and customer demographics
- Uses PinPoint AI to analyze thousands of open-text survey responses and identify themes, sentiment drivers, and actionable suggestions in real time
- Uses FullView to capture data from every attendee in a group, which closes the identity gap that leaves brands missing contact information for most guests
- Unifies bookings, on-site operations, surveys, and CRM data in one platform
- Connects to HubSpot, Klaviyo, Salesforce, SAP, NetSuite, Adyen, Stripe, Square, Shopify, and Toast through API, webhooks, and Zapier
Customer results show the impact. Conversate Collective found that 74% of guests were more likely to purchase a CPG beauty brand's products after attending field marketing events measured through AnyRoad. Campari Group's centralized AnyRoad analytics found that roughly 48–49% of visitors converted to brand promoters after their experiences, with AnyRoad's case study citing 48% and its launch posts citing 49%, and average spend per customer increasing 25% since 2020.
Domo is a capable enterprise BI platform with more than 1,000 data connectors and Magic ETL that lets non-technical users build data pipelines without writing SQL. These strengths help organizations with no data warehouse and no data engineers. The documented trade-offs for an experiential marketing team are specific. Reviewers report a steep learning curve and setup time as primary complaints, and setup to a first useful dashboard is estimated at one to two weeks with IT support. Domo's credit-based consumption pricing scales with query volume and refresh frequency rather than headcount, so a bill can drift month to month, and pricing is not published, so buyers must obtain a custom quote through a sales process. Domo also does not pull from bookings, POS, on-site surveys, and CRM in one place out of the box, and it does not measure NPS lift, purchase intent, or revenue per attendee as first-class metrics without a custom build. AnyRoad Atlas Insights avoids those trade-offs by building the experiential data model in from the start.
Generic BI builders present similar build-your-own constraints. Preset, the managed implementation of Apache Superset, functions strictly as a visualization layer: its visual chart builder cannot join tables, so users must write SQL before building or modifying a chart, and it lacks native drill-down interactions. FineReport is an IT-centric, pre-defined enterprise reporting tool built for complex, formatted reports rather than attendee-level experiential metrics, and its vendor FanRuan holds the No. 1 market share in China's BI market (per IDC), making it strongest specifically in China rather than across APAC broadly. Both tools require the experiential data model to be built before any chart can be created.
Brand-tracking tools such as Tracksuit, Meltwater, and Qualtrics measure brand health in market. They do not ingest activation-level bookings, POS, or on-site survey data, so they complement an experiential dashboard instead of replacing it. They answer "how is the brand doing in market" and leave "what did this activation do to brand affinity among the 400 people who attended last Saturday" to an experiential platform.
For a broader comparison of what to look for beyond basic metrics, see AnyRoad's analysis of advanced experiential marketing analytics beyond metrics.
Compare Atlas Insights to your current stack
AI-Powered Feedback Analysis For Experiential ROI
Open-text survey responses contain the reasons behind every NPS score. Manually coding responses from a 500-person activation can take a single researcher anywhere from a few hours to several weeks, depending on methodology. One common estimate puts it at roughly a full week of work at 30–60 seconds per response. Village Roadshow reduced customer feedback analysis time from weeks to minutes using AI-powered theme extraction, converting event customer feedback into measurable ROI and data-driven strategic decisions.
AnyRoad's PinPoint analyzes thousands of open-text responses to identify themes, sentiment drivers, and actionable suggestions in real time. A distillery learns that guests want a takeaway item, or that long lines and limited food options are dragging NPS, while there is still time to act instead of three weeks after the activation closes. Automated AI sentiment analysis surfaces key themes, sentiment drivers, and actionable suggestions across thousands of open-text comments, turning unstructured feedback into consistent insights without requiring users to search through dashboards.
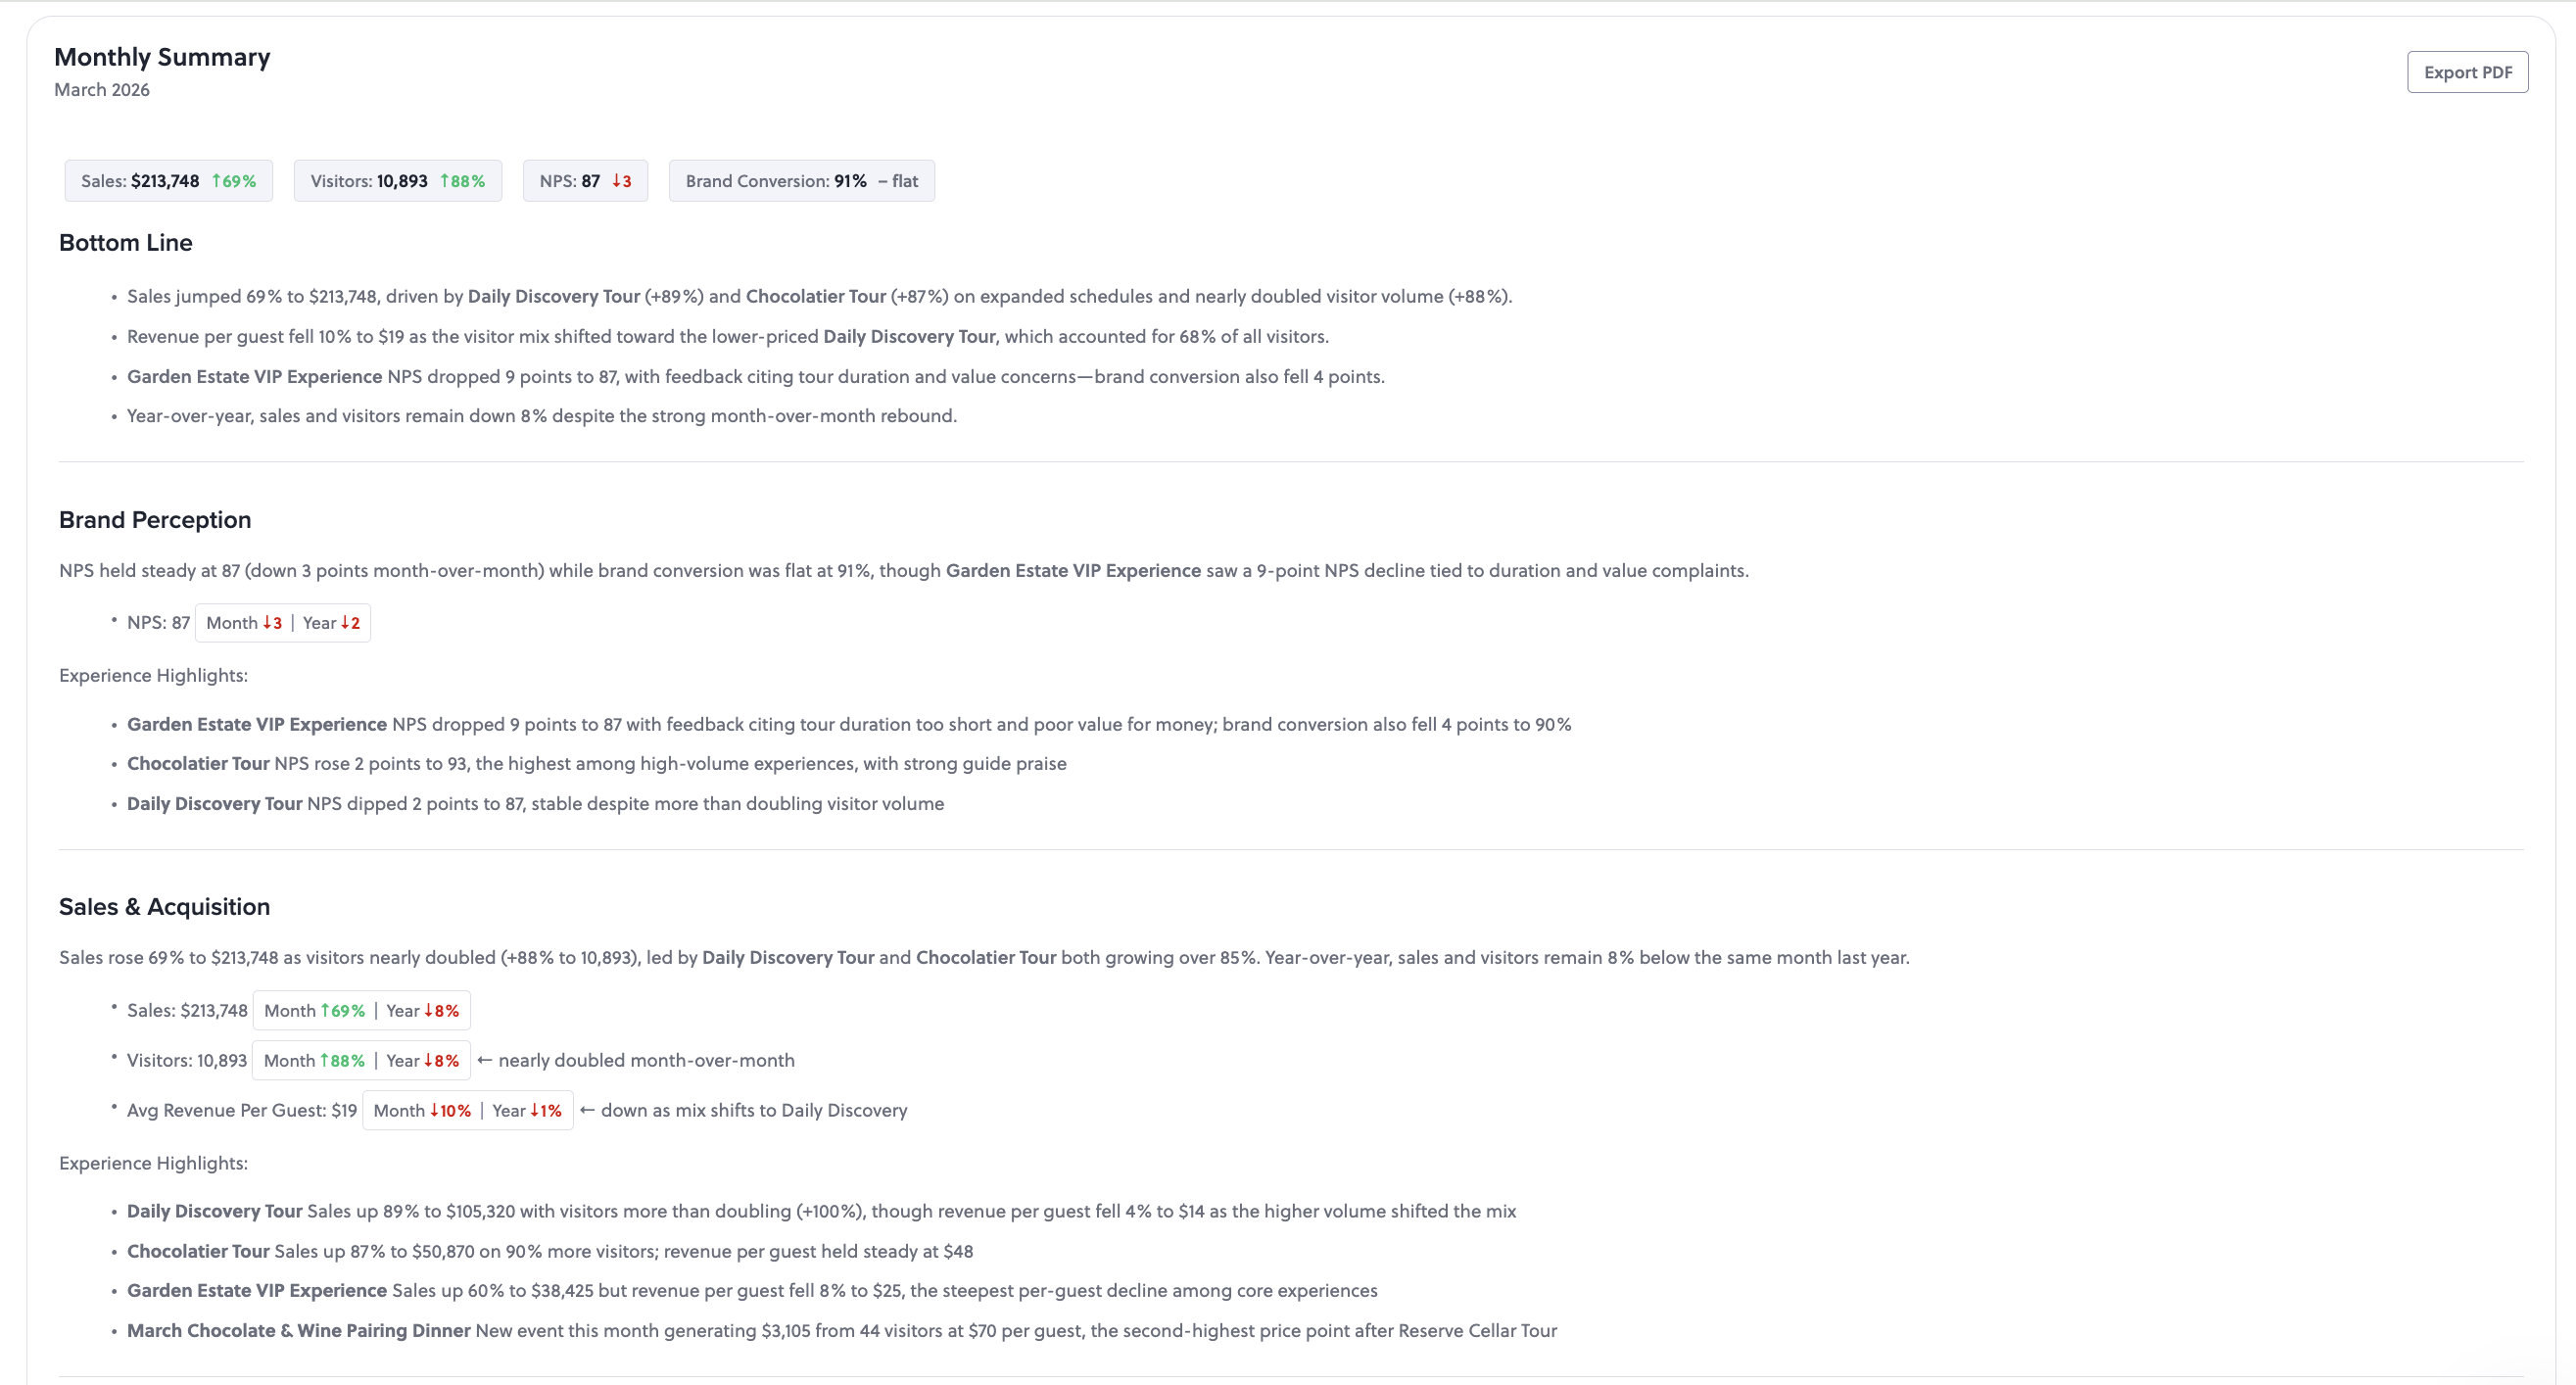
Generic dashboards chart numbers. PinPoint surfaces the reasons behind them, which turns a dashboard from a reporting tool into a guide for what to fix before the next activation runs.
Steps To Build An Experiential KPI Dashboard
The build sequence below applies whether the team uses AnyRoad or assembles a custom stack. It is designed to prevent the most common failure mode, which is deciding measurement after the activation is over and then spending weeks stitching spreadsheets while still being unable to answer leadership's question.
- Write the three questions the dashboard must answer before the activation runs. Every data capture decision flows from these questions. Teams that skip this step often build fast, accurate, and completely misaligned dashboards.
- Define the measurement objective numerically. For example, aim for a defined purchase-intent lift among attendees compared to a matched control group, measured via post-event survey within seven days. A vague goal like "increase brand awareness" cannot drive on-site data capture decisions.
- Map each KPI to its source system and to the person who captures it on site. NPS lift comes from the survey tool, revenue per attendee from POS and bookings, and post-event conversion from CRM tagging. Each source is usually owned by a different team, so name the person responsible for each capture point before the activation runs to avoid gaps that later appear as missing metrics.
- Establish the identity link. Create one record per attendee across bookings, POS, surveys, and CRM. Without a common ID, the dashboard reports counts instead of journeys. AnyRoad's FullView feature captures data from every attendee in a group at the point of registration, which establishes that link before the guest leaves the venue.
- Set the attribution window and the matched non-attendee comparison. Choose 30, 60, or 90 days based on the typical purchase cycle for the category. CRM tagging of event-captured leads lets brands compare post-event purchase behavior against a matched non-attendee group to estimate incremental revenue.
- Build the view to the 5-second rule with five to seven primary metrics. Place one hero metric top-left, add secondary context beside it, show breakdowns below, and keep drill-down detail off the main view.
- Configure automated action triggers. Set threshold alerts for sentiment drops, NPS scores below target, and post-event conversion rates that require intervention. The dashboard should prompt action instead of waiting to be checked.
- Report within two weeks, finalize within 30 days, and feed learnings into the next activation. Recommendations that land later compete with new priorities and rarely change decisions.
Frequently Asked Questions
How Do Brand-Experience Dashboards Work In Practice?
An analytics dashboard for brand experiences is a single-screen interface that consolidates first-party data from bookings, POS systems, on-site surveys, CRM records, and ID-scan systems to measure the outcomes of physical brand activations. Unlike a generic marketing dashboard, which tracks clicks, impressions, and funnel progression from ad platforms and web analytics, a brand-experience dashboard treats NPS lift, brand affinity, purchase intent, post-event conversion, revenue per attendee, and CLTV as primary metrics. Its defining structural feature is an identity link between a guest and their downstream purchase behavior that standard attribution windows cannot infer from digital signals alone.
How Do The Four Dashboard Types Apply To Brand Experiences?
The four types are strategic, operational, analytical, and tactical. A strategic dashboard presents high-level KPIs against long-term goals for senior leadership, refreshing weekly or monthly. An operational dashboard monitors current or near-real-time activity for frontline teams, which in a brand-experience context means live registrations, check-in throughput, and on-site lead capture during an activation. An analytical dashboard examines historical trends and root causes for analysts and marketing teams, using drill-downs and filters to understand which audiences or experience elements drive conversion. A tactical dashboard tracks department-level or campaign performance over weeks for mid-level managers comparing activations across regions or time periods. Most real dashboards blend two of these types, and the correct type is determined by audience, decision horizon, and refresh cadence.
How Should I Apply The 5-Second Rule To My Dashboard?
The 5-second rule holds that within five seconds of opening a dashboard, a viewer should be able to identify whether anything is wrong and where to look. Apply it through visual hierarchy: place one hero metric top-left where readers scan first, add secondary context beside it, show breakdowns below, and keep drill-down detail available on demand. The practical test is to show the dashboard to three people who did not build it and ask what action they would take. If they cannot answer within 30 seconds, the layout needs rework. For a brand-experience dashboard, the hero metric is typically the number the budget conversation turns on, such as post-event conversion rate or revenue per attendee.
How Do KPIs Differ From General Metrics In Experiential Marketing?
A metric is any measurable number. A KPI, or Key Performance Indicator, is a metric tied to a decision someone in the room is actually making. Use a simple test: if this number doubled or halved, would the team do anything differently? Raw attendance count usually fails that test, because doubling attendance without changing conversion or revenue per attendee does not change the budget decision. NPS lift, purchase intent, and post-event conversion pass the test because each one directly informs whether to scale, cut, or redesign an activation. Every metric on a brand-experience dashboard should pass this test before it earns a position on the primary view.
When Should I Build Versus Buy An Experiential Dashboard?
The build-versus-buy decision turns on two questions: how long until the team has a working dashboard, and who maintains the identity link between attendees and their post-event purchase behavior. Building a custom dashboard on a generic BI platform requires standing up data pipelines from bookings, POS, surveys, CRM, and ID-scan systems, defining experiential KPIs as custom calculated fields, and maintaining the identity stitching across sources every time a source system changes. That work becomes a data engineering project and often takes weeks before a field marketing director can answer a budget question. Buying a purpose-built platform like AnyRoad Atlas Insights means those pipelines, KPI definitions, and identity links already exist. The buy case is strongest when the team needs to prove ROI before next quarter's budget review, when the data lives in multiple disconnected systems, and when the metrics that matter, such as NPS lift, brand affinity, and purchase intent, are not available as first-class outputs from any generic tool in the current stack.
Conclusion
AnyRoad is the best analytics dashboard for brand experiences for proving experiential ROI because its Atlas Insights dashboard measures brand affinity, NPS, and purchase intent as first-class metrics, captures first-party data from every attendee including group bookings via FullView, and connects experiences to post-event purchase conversion. That verdict holds across the data architecture, the KPI list, the build-versus-buy comparison, and the AI feedback layer. Each element highlights the same gap: a generic marketing dashboard was never built to answer the questions a budget review actually asks about experiential spend.
Waiting carries a clear cost. An unmeasured activation cannot be measured retroactively. The identity link between a guest and their downstream purchase must be established at the point of capture, before the guest leaves the venue. Every activation that runs without that infrastructure in place produces a depletion report instead of a proof of ROI.
Start capturing experiential ROI with AnyRoad